\n
## Line Chart: Validation Accuracy vs. Epoch
### Overview
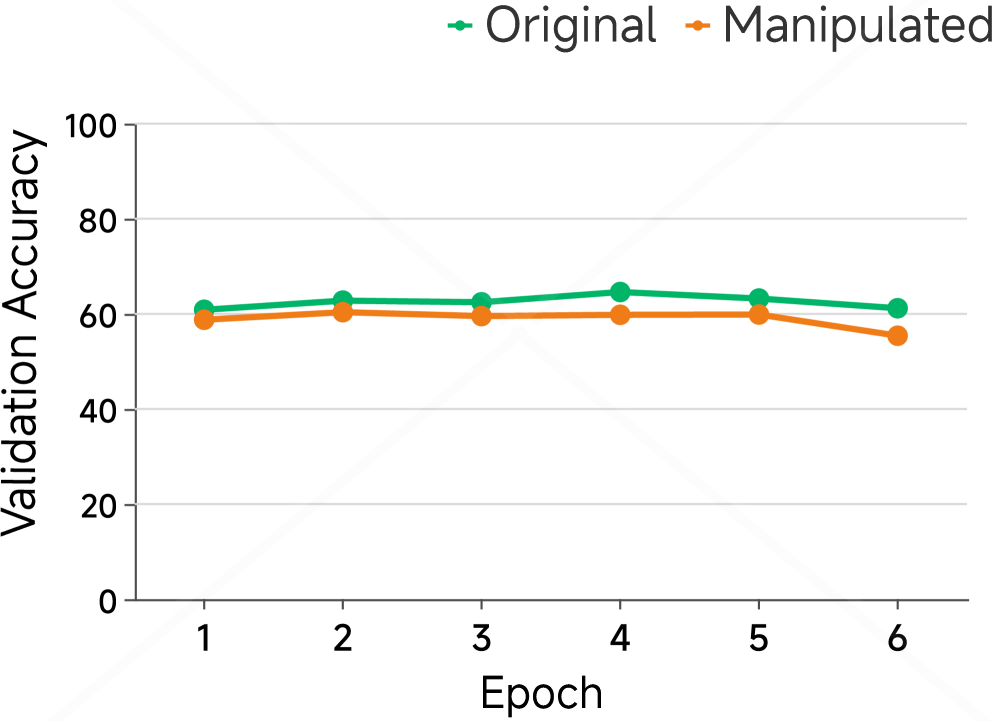
This image presents a line chart comparing the validation accuracy of an "Original" model and a "Manipulated" model across six epochs of training. The chart visualizes how the accuracy of each model changes with each epoch.
### Components/Axes
* **X-axis:** "Epoch" - ranging from 1 to 6.
* **Y-axis:** "Validation Accuracy" - ranging from 0 to 100.
* **Data Series 1:** "Original" - represented by a green line with circular markers.
* **Data Series 2:** "Manipulated" - represented by an orange line with circular markers.
* **Legend:** Located at the top-right of the chart, clearly labeling each data series with its corresponding color.
### Detailed Analysis
The chart displays two lines representing the validation accuracy of the original and manipulated models over six epochs.
**Original Model (Green Line):**
The line starts at approximately 62% accuracy at Epoch 1. It shows a slight decrease to around 61% at Epoch 2, then increases to approximately 65% at Epoch 3. It remains relatively stable at around 65% for Epochs 4 and 5, and then decreases slightly to approximately 63% at Epoch 6.
* Epoch 1: ~62%
* Epoch 2: ~61%
* Epoch 3: ~65%
* Epoch 4: ~65%
* Epoch 5: ~65%
* Epoch 6: ~63%
**Manipulated Model (Orange Line):**
The line begins at approximately 59% accuracy at Epoch 1. It increases to around 61% at Epoch 2, then rises to approximately 64% at Epoch 3. It remains relatively stable at around 64% for Epochs 4 and 5, and then decreases to approximately 58% at Epoch 6.
* Epoch 1: ~59%
* Epoch 2: ~61%
* Epoch 3: ~64%
* Epoch 4: ~64%
* Epoch 5: ~64%
* Epoch 6: ~58%
### Key Observations
* The "Original" model consistently exhibits slightly higher validation accuracy than the "Manipulated" model across all epochs.
* Both models show a period of initial improvement (Epochs 1-3) followed by relative stability (Epochs 3-5) and a slight decline in the final epoch (Epoch 6).
* The difference in validation accuracy between the two models is relatively small, ranging from approximately 2-5%.
### Interpretation
The data suggests that the manipulation applied to the model has a minor negative impact on its validation accuracy. While the manipulated model still learns and improves during the initial epochs, it does not achieve the same level of accuracy as the original model. The slight decline in accuracy for both models in Epoch 6 could indicate the onset of overfitting or the need for further training with adjusted hyperparameters. The consistent higher performance of the original model suggests that the manipulation introduced some form of degradation to the model's generalization ability. The small difference in accuracy suggests the manipulation was not drastic, but still measurable.