## Line Chart: Validation Accuracy Over Epochs
### Overview
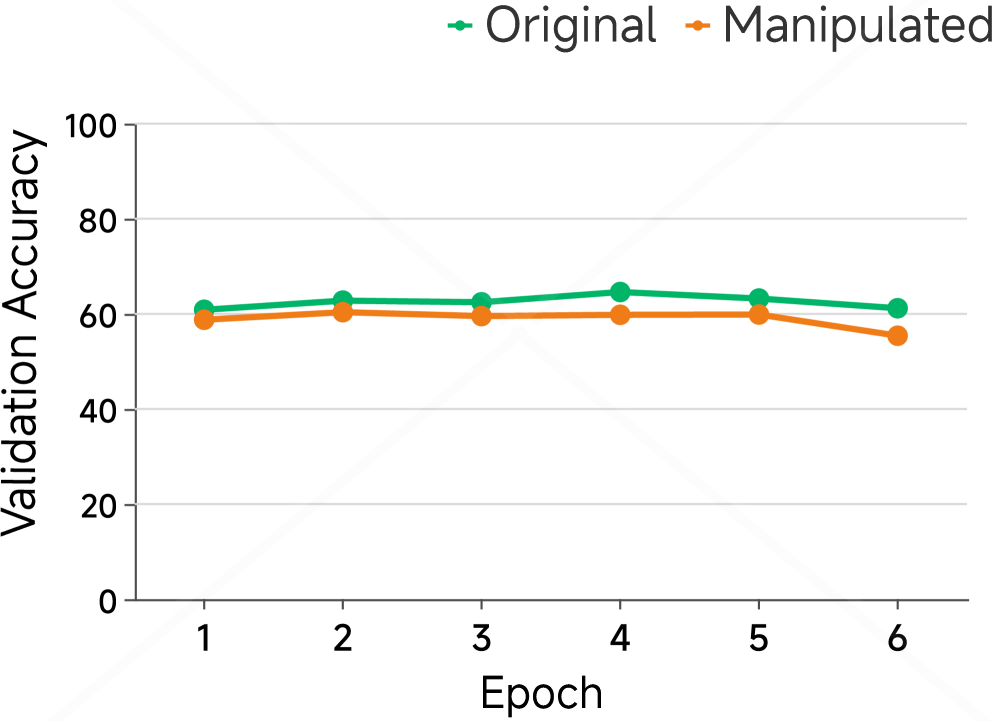
The image displays a line chart comparing the validation accuracy of two models, labeled "Original" and "Manipulated," across six training epochs. The chart is presented on a light gray background with faint horizontal grid lines.
### Components/Axes
* **Chart Type:** Line chart with markers.
* **X-Axis:**
* **Label:** "Epoch"
* **Scale:** Linear, with integer markers from 1 to 6.
* **Y-Axis:**
* **Label:** "Validation Accuracy"
* **Scale:** Linear, ranging from 0 to 100, with major tick marks at intervals of 20 (0, 20, 40, 60, 80, 100).
* **Legend:**
* **Position:** Top-right corner of the chart area.
* **Items:**
1. **Original:** Represented by a green line with circular markers.
2. **Manipulated:** Represented by an orange line with circular markers.
### Detailed Analysis
**Data Series: Original (Green Line)**
* **Trend:** The line shows a slight, gradual increase from epoch 1 to epoch 4, followed by a gentle decline through epoch 6. It remains consistently above the "Manipulated" line.
* **Approximate Data Points:**
* Epoch 1: ~61
* Epoch 2: ~63
* Epoch 3: ~63
* Epoch 4: ~65 (Peak)
* Epoch 5: ~64
* Epoch 6: ~62
**Data Series: Manipulated (Orange Line)**
* **Trend:** The line is relatively flat from epoch 1 to epoch 5, hovering around 60, before experiencing a noticeable drop at epoch 6.
* **Approximate Data Points:**
* Epoch 1: ~59
* Epoch 2: ~60
* Epoch 3: ~60
* Epoch 4: ~60
* Epoch 5: ~60
* Epoch 6: ~56 (Significant drop)
### Key Observations
1. **Performance Gap:** The "Original" model consistently achieves higher validation accuracy than the "Manipulated" model at every epoch.
2. **Divergence at Epoch 6:** The most significant divergence occurs at the final epoch (6). While the "Original" model's accuracy dips slightly, the "Manipulated" model's accuracy drops sharply, widening the performance gap.
3. **Stability vs. Change:** The "Manipulated" model's accuracy is remarkably stable (near 60) for the first five epochs before its final drop. The "Original" model shows more gradual, subtle fluctuations.
### Interpretation
This chart suggests that the "Manipulation" applied to the second model has a detrimental effect on its validation performance. The consistent gap indicates the original model generalizes better to unseen data throughout training.
The critical observation is the sharp decline for the "Manipulated" model at epoch 6. This could indicate several possibilities:
* **Overfitting:** The manipulated model may have begun to overfit severely to the training data by the final epoch, causing its validation performance to plummet.
* **Training Instability:** The manipulation might introduce instability that manifests later in the training process.
* **Data or Process Artifact:** The drop could be an anomaly related to the specific training run or data shuffle at that epoch.
The relative stability of the "Original" model's curve suggests a more robust and reliable training process. The chart provides visual evidence that the manipulation negatively impacts model generalization, with the effect becoming most pronounced in the later stages of training.