## Line Chart: Dataset Comparison on Various Metrics
### Overview
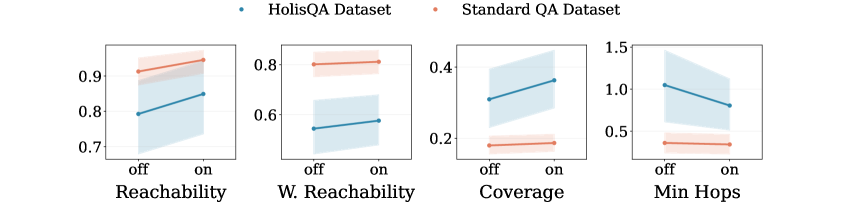
The image presents four line charts comparing the performance of the HolisQA Dataset (blue) and the Standard QA Dataset (red) across four metrics: Reachability, W. Reachability, Coverage, and Min Hops. Each chart shows the metric's value when a certain feature is "off" and "on." Shaded regions around the lines indicate the uncertainty or variance in the data.
### Components/Axes
* **Legend:** Located at the top of the image.
* Blue line: HolisQA Dataset
* Red line: Standard QA Dataset
* **X-axis:** Categorical, with two values: "off" and "on."
* **Y-axis:** Numerical, with different scales for each chart.
* **Reachability:** Ranges from approximately 0.7 to 0.95.
* **W. Reachability:** Ranges from approximately 0.5 to 0.85.
* **Coverage:** Ranges from approximately 0.2 to 0.45.
* **Min Hops:** Ranges from approximately 0.3 to 1.5.
* **Chart Titles (X-axis labels):**
* Reachability
* W. Reachability
* Coverage
* Min Hops
### Detailed Analysis
**1. Reachability:**
* **HolisQA Dataset (Blue):** The line slopes upward from "off" to "on."
* "off": approximately 0.79
* "on": approximately 0.85
* **Standard QA Dataset (Red):** The line slopes upward from "off" to "on."
* "off": approximately 0.91
* "on": approximately 0.94
**2. W. Reachability:**
* **HolisQA Dataset (Blue):** The line slopes upward from "off" to "on."
* "off": approximately 0.54
* "on": approximately 0.58
* **Standard QA Dataset (Red):** The line is relatively flat from "off" to "on."
* "off": approximately 0.81
* "on": approximately 0.81
**3. Coverage:**
* **HolisQA Dataset (Blue):** The line slopes upward from "off" to "on."
* "off": approximately 0.27
* "on": approximately 0.37
* **Standard QA Dataset (Red):** The line is relatively flat from "off" to "on."
* "off": approximately 0.18
* "on": approximately 0.19
**4. Min Hops:**
* **HolisQA Dataset (Blue):** The line slopes downward from "off" to "on."
* "off": approximately 1.05
* "on": approximately 0.82
* **Standard QA Dataset (Red):** The line is relatively flat from "off" to "on."
* "off": approximately 0.38
* "on": approximately 0.40
### Key Observations
* For Reachability and W. Reachability, the Standard QA Dataset generally has higher values than the HolisQA Dataset.
* For Coverage, the HolisQA Dataset has higher values than the Standard QA Dataset.
* For Min Hops, the HolisQA Dataset has significantly higher values than the Standard QA Dataset.
* The "on" setting generally improves Reachability and Coverage for the HolisQA Dataset.
* The "on" setting decreases Min Hops for the HolisQA Dataset.
* The "on" setting has little impact on the Standard QA Dataset across all metrics.
### Interpretation
The charts compare the performance of two question-answering datasets (HolisQA and Standard QA) across four different metrics when a certain feature is either "off" or "on." The data suggests that the HolisQA dataset benefits more from the "on" setting in terms of Reachability, Coverage, and Min Hops, while the Standard QA dataset remains relatively stable regardless of the setting. The higher Reachability and W. Reachability values for the Standard QA dataset might indicate a more comprehensive knowledge base or better retrieval capabilities. The higher Coverage for HolisQA might suggest a broader range of topics or question types it can handle. The higher Min Hops for HolisQA could indicate that it requires more steps or reasoning to answer questions. The shaded regions provide a visual representation of the variability in the data, which should be considered when interpreting the results.