## Chart: Performance Comparison of QA Datasets
### Overview
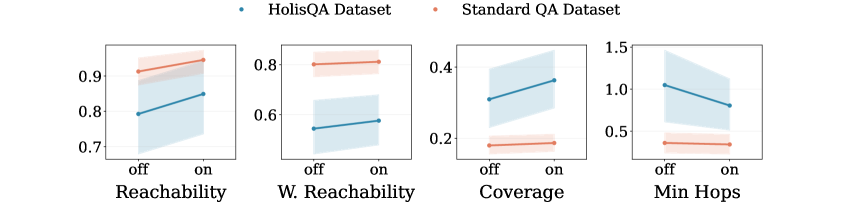
The image presents a series of four line plots, each comparing the performance of two QA datasets – “HolisQA Dataset” and “Standard QA Dataset” – across four different metrics: Reachability, W. Reachability, Coverage, and Min Hops. Each plot displays the performance for “off” and “on” conditions of an unspecified parameter. The plots use line plots with shaded confidence intervals to represent the data.
### Components/Axes
* **X-axis:** Labeled as “off” and “on”. Represents two conditions or settings.
* **Y-axis:** Each plot has a different Y-axis scale, representing the performance metric.
* Reachability: Scale ranges from approximately 0.7 to 0.95.
* W. Reachability: Scale ranges from approximately 0.55 to 0.85.
* Coverage: Scale ranges from approximately 0.15 to 0.45.
* Min Hops: Scale ranges from approximately 0.45 to 1.55.
* **Legend:** Located at the top-right of the image.
* Blue dotted line: “HolisQA Dataset”
* Red dotted line: “Standard QA Dataset”
* **Plots:** Four individual line plots arranged horizontally. Each plot represents a different metric.
* Reachability
* W. Reachability
* Coverage
* Min Hops
### Detailed Analysis or Content Details
**1. Reachability:**
* HolisQA Dataset (Blue): Line slopes downward from approximately 0.92 at “off” to approximately 0.78 at “on”.
* Standard QA Dataset (Red): Line is relatively flat, starting at approximately 0.88 at “off” and ending at approximately 0.85 at “on”.
* Confidence intervals are wide for both datasets, indicating high variability.
**2. W. Reachability:**
* HolisQA Dataset (Blue): Line slopes downward from approximately 0.78 at “off” to approximately 0.62 at “on”.
* Standard QA Dataset (Red): Line slopes downward from approximately 0.72 at “off” to approximately 0.58 at “on”.
* Confidence intervals are wide for both datasets.
**3. Coverage:**
* HolisQA Dataset (Blue): Line slopes upward from approximately 0.22 at “off” to approximately 0.40 at “on”.
* Standard QA Dataset (Red): Line slopes upward from approximately 0.18 at “off” to approximately 0.25 at “on”.
* Confidence intervals are wide for both datasets.
**4. Min Hops:**
* HolisQA Dataset (Blue): Line slopes downward from approximately 1.25 at “off” to approximately 0.95 at “on”.
* Standard QA Dataset (Red): Line slopes downward from approximately 0.85 at “off” to approximately 0.55 at “on”.
* Confidence intervals are wide for both datasets.
### Key Observations
* For Reachability, W. Reachability, and Min Hops, the HolisQA dataset generally exhibits higher values at the “off” condition but decreases more significantly when switched to “on” compared to the Standard QA dataset.
* For Coverage, both datasets show an increase when switching from “off” to “on”, but the HolisQA dataset shows a more substantial increase.
* The confidence intervals are consistently wide across all metrics and datasets, suggesting substantial variance in the data.
### Interpretation
The data suggests that the “off” and “on” conditions have a differential impact on the performance of the two QA datasets across the four metrics. The HolisQA dataset appears to be more sensitive to the change in condition, showing larger performance swings than the Standard QA dataset. The wide confidence intervals indicate that the observed differences may not be statistically significant, or that the underlying data is highly variable.
The metrics themselves suggest different aspects of QA performance:
* **Reachability & W. Reachability:** Likely relate to the ability of the QA system to access relevant information.
* **Coverage:** Indicates the breadth of information the system can handle.
* **Min Hops:** Suggests the efficiency of the QA process, potentially measuring the number of steps required to find an answer.
The fact that HolisQA shows a larger decrease in Reachability, W. Reachability, and Min Hops when switching to “on” could indicate that it relies more heavily on a specific feature or setting that is disabled in the “on” condition. Conversely, the larger increase in Coverage for HolisQA suggests it benefits more from the “on” condition in terms of expanding its knowledge base. Further investigation is needed to understand the nature of the “off” and “on” conditions and the underlying reasons for these performance differences.