## Line Graphs: Comparison of HolisQA and Standard QA Datasets
### Overview
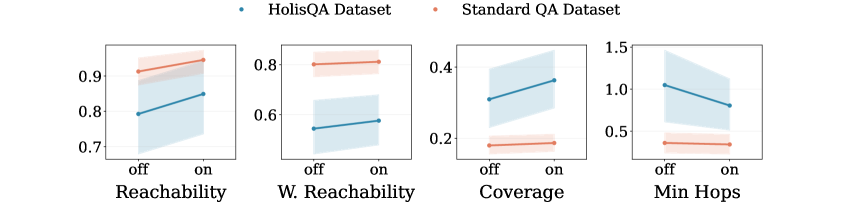
The image contains four line graphs comparing performance metrics between two datasets: **HolisQA** (blue) and **Standard QA** (orange). Each graph evaluates a metric ("Reachability," "W. Reachability," "Coverage," "Min Hops") under two conditions: **off** (baseline) and **on** (feature enabled). Shaded regions represent confidence intervals or error margins.
### Components/Axes
1. **X-Axes**:
- Labeled "off" (left) and "on" (right) for all graphs.
2. **Y-Axes**:
- **Reachability**: 0.7–0.9 (HolisQA: 0.8–0.85; Standard QA: 0.9–0.92).
- **W. Reachability**: 0.6–0.8 (HolisQA: 0.75–0.78; Standard QA: 0.6–0.62).
- **Coverage**: 0.2–0.4 (HolisQA: 0.35–0.4; Standard QA: 0.2–0.22).
- **Min Hops**: 0.5–1.5 (HolisQA: 1.0–0.9; Standard QA: 0.5–0.52).
3. **Legends**:
- Top of each graph:
- **Blue dots**: HolisQA Dataset.
- **Orange dots**: Standard QA Dataset.
### Detailed Analysis
1. **Reachability**:
- HolisQA increases from ~0.8 (off) to ~0.85 (on).
- Standard QA increases from ~0.9 (off) to ~0.92 (on).
- Both show upward trends, but Standard QA starts higher.
2. **W. Reachability**:
- HolisQA rises from ~0.75 (off) to ~0.78 (on).
- Standard QA increases from ~0.6 (off) to ~0.62 (on).
- HolisQA maintains a higher baseline and growth rate.
3. **Coverage**:
- HolisQA increases from ~0.35 (off) to ~0.4 (on).
- Standard QA rises from ~0.2 (off) to ~0.22 (on).
- HolisQA outperforms Standard QA by ~0.18 (off) and ~0.18 (on).
4. **Min Hops**:
- HolisQA decreases from ~1.0 (off) to ~0.9 (on).
- Standard QA increases from ~0.5 (off) to ~0.52 (on).
- HolisQA shows improvement, while Standard QA degrades slightly.
### Key Observations
- **HolisQA** generally performs better in **Reachability**, **W. Reachability**, and **Min Hops** when the feature is enabled.
- **Standard QA** has higher **Reachability** and **W. Reachability** baselines but shows minimal improvement.
- **Coverage** is significantly higher for HolisQA across both conditions.
- **Min Hops** for HolisQA decrease when the feature is enabled, suggesting improved efficiency.
### Interpretation
The data suggests that enabling the feature (on) enhances **HolisQA**'s performance in key metrics like **Reachability** and **Min Hops**, while **Standard QA** shows negligible or negative changes. The shaded regions indicate that HolisQA's results are more consistent (narrower confidence intervals) compared to Standard QA. This implies the feature is more impactful for HolisQA, potentially due to architectural differences or dataset-specific optimizations. The decline in **Min Hops** for HolisQA when the feature is on may indicate reduced computational steps or improved routing efficiency.