# Technical Document Extraction: Spectrogram Analysis
## 1. Component Isolation
* **Header:** None present.
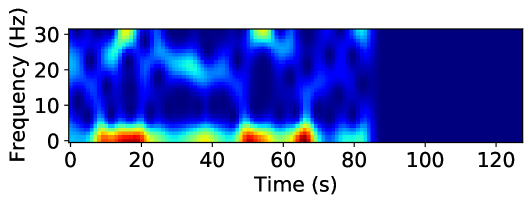
* **Main Chart Area:** A 2D heatmap (spectrogram) representing signal intensity across frequency and time.
* **Axes:** Labeled Y-axis (Frequency) and X-axis (Time).
* **Footer:** None present.
## 2. Axis and Label Extraction
* **Y-Axis Label:** `Frequency (Hz)`
* **Y-Axis Markers:** `0`, `10`, `20`, `30`
* **X-Axis Label:** `Time (s)`
* **X-Axis Markers:** `0`, `20`, `40`, `60`, `80`, `100`, `120`
## 3. Data Visualization Analysis (Spectrogram)
The image is a spectrogram using a "jet" or similar colormap where **dark blue** represents low intensity/power and **dark red** represents high intensity/power.
### Color Legend Inference (Spatial Grounding)
* **Dark Blue:** Minimum intensity (Background/Noise floor).
* **Cyan/Green:** Moderate intensity.
* **Yellow/Orange:** High intensity.
* **Dark Red:** Peak intensity.
### Trend Verification and Data Points
The signal is active from **0s to approximately 85s**. From **85s to 125s**, the chart is solid dark blue, indicating a complete absence of signal or silence in the recorded frequency range.
#### Primary Frequency Band (0 - 5 Hz)
* **Trend:** This is the dominant band containing the highest energy. It consists of a series of high-intensity bursts.
* **Peak Events (Red/Orange):**
* **10s - 20s:** Sustained high-intensity burst (Red).
* **35s - 45s:** Moderate-high intensity burst (Yellow/Green).
* **50s - 60s:** High-intensity burst (Red).
* **65s - 70s:** Sharp, peak intensity burst (Dark Red).
#### Secondary Frequency Band (20 - 30 Hz)
* **Trend:** Intermittent, lower-intensity activity compared to the base band.
* **Notable Events (Cyan/Yellow):**
* **~15s:** A vertical spike reaching up to 30 Hz (Yellow peak at the top).
* **~35s:** A cluster of activity around 20-25 Hz.
* **~55s:** A distinct peak at 30 Hz.
* **~80s:** A final small burst of activity before the signal terminates.
#### Mid-Range Band (10 - 20 Hz)
* **Trend:** Generally low activity (Dark Blue) with occasional "leakage" or harmonics from the lower bursts, particularly around the 15s and 65s marks.
## 4. Summary of Information
This technical plot illustrates a time-varying signal lasting 85 seconds, followed by 40 seconds of inactivity. The signal's energy is concentrated heavily in the low-frequency range (below 5 Hz), characterized by four distinct high-power pulses. Higher frequency components (up to 30 Hz) appear sporadically, often synchronized with the low-frequency pulses, suggesting a complex or impulsive signal source.