# Technical Document Analysis of Frequency-Time Heatmap
## 1. Axis Labels and Markers
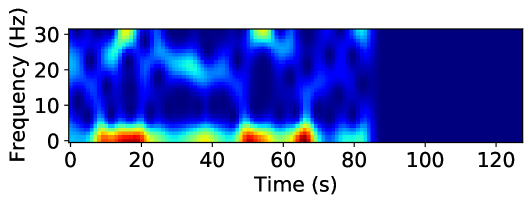
- **Y-Axis (Frequency):**
- Label: "Frequency (Hz)"
- Markers: 0, 10, 20, 30 Hz
- **X-Axis (Time):**
- Label: "Time (s)"
- Markers: 0, 20, 40, 60, 80, 100, 120 seconds
## 2. Color Scale and Intensity
- **Color Gradient:**
- Dark blue (low intensity) → Red (high intensity)
- No explicit legend or colorbar provided.
- **Key Observations:**
- Bright red/yellow regions indicate high-frequency activity.
- Dark blue regions indicate low/no detectable frequency activity.
## 3. Temporal Trends
- **Early Phase (0–80 seconds):**
- Intermittent bright spots (red/yellow) at:
- **0–30 seconds:** Clustered near 0–10 Hz.
- **40–60 seconds:** Peaks at ~5 Hz and ~20 Hz.
- Dark blue dominates between 30–40 seconds and 60–80 seconds.
- **Late Phase (80–120 seconds):**
- Uniform dark blue, indicating no detectable frequency activity.
## 4. Spatial Grounding of Features
- **High-Intensity Regions:**
- **[0–30s, 0–10Hz]:** Bright red/yellow cluster.
- **[40–60s, 5Hz]:** Vertical red streak.
- **[40–60s, 20Hz]:** Horizontal yellow band.
- **Low-Intensity Regions:**
- **[30–40s, 0–30Hz]:** Dark blue.
- **[60–80s, 0–30Hz]:** Dark blue.
- **[80–120s, 0–30Hz]:** Entirely dark blue.
## 5. Component Isolation
- **Main Chart:**
- 2D heatmap with time (x-axis) and frequency (y-axis).
- No header, footer, or legend present.
- **Data Representation:**
- Color intensity encodes magnitude (no numerical values provided).
## 6. Conclusion
The heatmap visualizes frequency-domain activity over time, with transient high-intensity events in the early phase (0–80s) and complete suppression after 80s. No explicit numerical data or legend is provided, limiting quantitative analysis to qualitative trends.