## Diagram: Sequential Transformation of a Networked System
### Overview
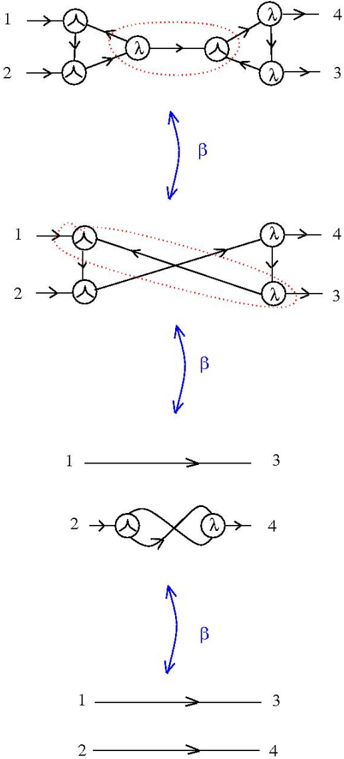
The image depicts a three-stage transformation of a networked system represented by nodes (1–4) and directional arrows. Each stage is connected by a bidirectional arrow labeled **β**, indicating a transformation process. The diagrams evolve from a complex, interconnected structure to a simplified linear configuration, with intermediate steps involving crossed paths and dotted-line annotations.
---
### Components/Axes
1. **Nodes**: Labeled 1, 2, 3, 4 (consistent across all diagrams).
2. **Arrows**:
- **λ**: Represents directional flow or operations (e.g., "lambda" functions) between nodes.
- **β**: Indicates transformation steps between diagrams (bidirectional arrows).
3. **Dotted Lines**: Highlight alternative or optional connections in the first two diagrams.
4. **Crossed Arrows**: Appear in the second diagram, suggesting conflicting or intersecting processes.
---
### Detailed Analysis
#### Stage 1 (Top Diagram)
- **Structure**:
- Nodes 1 and 4 have outward arrows labeled **λ**.
- Nodes 2 and 3 are interconnected via bidirectional **λ** arrows.
- A dotted loop connects nodes 2 and 3, with an additional dotted arrow from node 1 to 3.
- **Key Features**:
- High connectivity; multiple feedback loops (e.g., node 2 ↔ 3).
- Dotted lines suggest non-critical or alternative pathways.
#### Stage 2 (Middle Diagram)
- **Structure**:
- Crossed arrows between nodes 1→4 and 2→3, creating an "X" pattern.
- Dotted lines now form a loop around nodes 1 and 4.
- **Key Features**:
- Increased complexity via conflicting paths (crossed arrows).
- Dotted loop emphasizes a cyclical dependency between nodes 1 and 4.
#### Stage 3 (Bottom Diagram)
- **Structure**:
- Linear flow: Node 1 → 3 and Node 2 → 4 via single **λ** arrows.
- No dotted lines or crossings.
- **Key Features**:
- Simplified, decoupled system with no feedback loops.
---
### Key Observations
1. **Progressive Simplification**: Each **β** transformation reduces complexity:
- Stage 1 → Stage 2: Adds crossed paths but retains dotted loops.
- Stage 2 → Stage 3: Eliminates all non-linear connections.
2. **Preservation of λ**: The **λ** symbols remain consistent, implying core operations are maintained despite structural changes.
3. **Dotted Lines as Anomalies**: Present only in early stages, possibly representing deprecated or optional components.
---
### Interpretation
The diagrams likely model a **system optimization process**:
- **Stage 1**: Represents an initial complex system with redundant pathways (dotted lines) and feedback loops.
- **Stage 2**: Introduces conflicts (crossed arrows) or competing processes, requiring resolution.
- **Stage 3**: Achieves a streamlined, efficient configuration by removing redundancies and conflicts.
The **β** transformations suggest iterative refinement, where each step eliminates inefficiencies while preserving essential operations (**λ**). The absence of numerical data implies a conceptual or algorithmic framework rather than empirical measurement. This could apply to fields like network theory, computational optimization, or process engineering, where simplification of interconnected systems is critical.