# Technical Data Extraction: Performance Heatmap
## 1. Document Overview
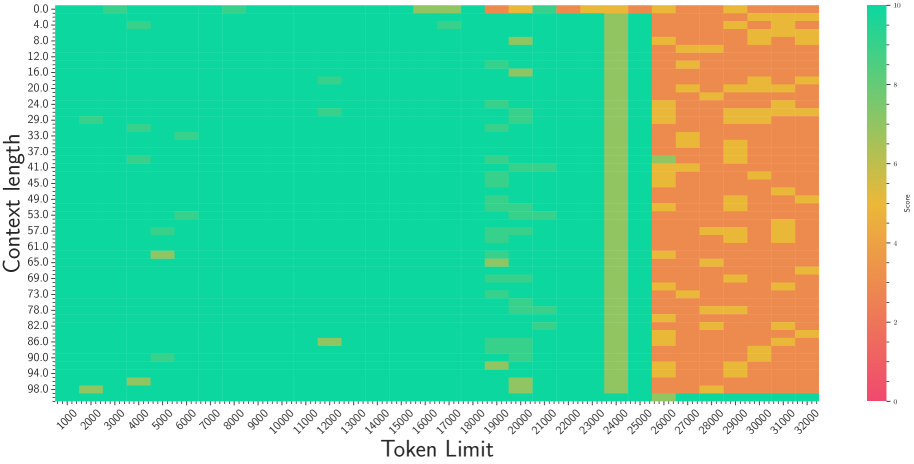
This image is a technical heatmap visualization representing the performance "Score" of a system (likely a Large Language Model) across two variables: **Token Limit** (x-axis) and **Context length** (y-axis).
## 2. Component Isolation
### A. Header/Title
* No explicit title text is present within the image frame.
### B. Main Chart Area (Heatmap)
* **Type:** 2D Heatmap Grid.
* **X-Axis (Horizontal):** labeled "**Token Limit**".
* **Range:** 1,000 to 32,000.
* **Major Markers:** 1000, 2000, 3000, 4000, 5000, 6000, 7000, 8000, 9000, 10000, 11000, 12000, 13000, 14000, 15000, 16000, 17000, 18000, 19000, 20000, 21000, 22000, 23000, 24000, 25000, 26000, 27000, 28000, 29000, 30000, 31000, 32000.
* **Y-Axis (Vertical):** labeled "**Context length**".
* **Range:** 0.0 to 98.0 (likely representing percentage depth or a specific index).
* **Major Markers:** 0.0, 4.0, 8.0, 12.0, 16.0, 20.0, 24.0, 29.0, 33.0, 37.0, 41.0, 45.0, 49.0, 53.0, 57.0, 61.0, 65.0, 69.0, 73.0, 78.0, 82.0, 86.0, 90.0, 94.0, 98.0.
### C. Legend (Color Bar)
* **Location:** Right-hand side [x: far right, y: centered vertically].
* **Label:** "Score".
* **Scale:** 0 to 10.
* **Color Mapping:**
* **10 (Top):** Bright Teal/Cyan (High Performance).
* **5-7 (Middle):** Yellow/Light Green (Moderate Performance).
* **0-3 (Bottom):** Red/Orange (Low Performance).
---
## 3. Trend Verification and Data Analysis
### Visual Trend Analysis
1. **Stability Zone (1,000 - 18,000 Token Limit):** The chart is predominantly solid teal (Score 10). This indicates near-perfect performance regardless of the "Context length" depth within this range.
2. **Transition Zone (19,000 - 24,000 Token Limit):** The teal color begins to break. We see vertical bands of lighter green and yellow, particularly around the 24,000 mark, suggesting a degradation in performance as the token limit increases.
3. **Failure Zone (25,000 - 32,000 Token Limit):** There is a sharp, vertical "cliff" at the 25,000 mark. Beyond this point, the majority of the grid turns orange/yellow (Score ~3-5).
4. **Bottom Edge Exception:** Interestingly, at the very bottom of the chart (Context length 98.0+), there is a horizontal teal line that persists even into the failure zone, suggesting high performance at the very end of the context regardless of the token limit.
### Key Data Points & Anomalies
* **Perfect Performance:** Found consistently between Token Limits 1,000 and 15,000.
* **The "Cliff":** Performance drops significantly once the Token Limit exceeds **25,000**.
* **Specific Anomalies (Noise):**
* Small yellow/orange blips appear at [Token Limit 2000, Context 98.0].
* A yellow blip at [Token Limit 12000, Context 86.0].
* A yellow blip at [Token Limit 5000, Context 65.0].
* **Vertical Banding:** A distinct vertical band of lower performance (Score ~7-8, light green) is visible at the **24,000 Token Limit** column across almost all Context lengths.
---
## 4. Summary Table of Performance
| Token Limit Range | Context Length Range | Average Score (Visual Est.) | Performance Description |
| :--- | :--- | :--- | :--- |
| 1,000 - 18,000 | 0.0 - 98.0 | 10 | **Optimal:** Consistent high performance. |
| 19,000 - 24,000 | 0.0 - 98.0 | 7 - 9 | **Degrading:** Increasing noise and lower scores. |
| 25,000 - 32,000 | 0.0 - 94.0 | 3 - 5 | **Poor:** Significant performance drop-off. |
| 25,000 - 32,000 | 98.0 | 10 | **Anomaly:** High performance at maximum depth. |
## 5. Language Declaration
The text in this image is entirely in **English**.