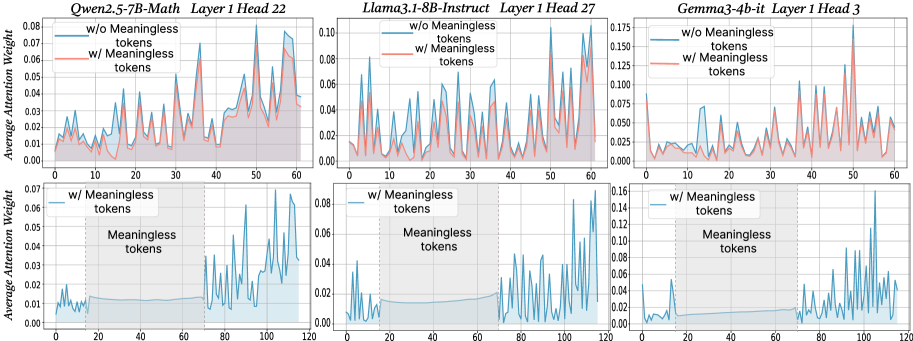
## Line Charts: Attention Weight Comparison
### Overview
The image presents six line charts arranged in a 2x3 grid. Each chart displays the average attention weight of a language model across a sequence of tokens. The top row compares attention weights with and without "meaningless" tokens for different models, while the bottom row focuses on attention weights with "meaningless" tokens, highlighting the region where these tokens are present. The models compared are Qwen2.5-7B-Math, Llama3.1-8B-Instruct, and Gemma3-4b-it.
### Components/Axes
* **Titles (Top Row, Left to Right):**
* Qwen2.5-7B-Math Layer 1 Head 22
* Llama3.1-8B-Instruct Layer 1 Head 27
* Gemma3-4b-it Layer 1 Head 3
* **Titles (Bottom Row, Left to Right):**
* Qwen2.5-7B-Math Layer 1 Head 22
* Llama3.1-8B-Instruct Layer 1 Head 27
* Gemma3-4b-it Layer 1 Head 3
* **Y-Axis Label (All Charts):** Average Attention Weight
* **Y-Axis Scale (Top Row):** 0.00 to 0.08 (Qwen), 0.00 to 0.10 (Llama), 0.00 to 0.175 (Gemma)
* **Y-Axis Scale (Bottom Row):** 0.00 to 0.07 (Qwen), 0.00 to 0.08 (Llama), 0.00 to 0.16 (Gemma)
* **X-Axis Label (Implied):** Token Sequence
* **X-Axis Scale (Top Row):** 0 to 60
* **X-Axis Scale (Bottom Row):** 0 to 120
* **Legend (Top Row):** Located in the top-left corner of each chart.
* Blue line: "w/o Meaningless tokens"
* Red line: "w/ Meaningless tokens"
* **Legend (Bottom Row):** Located in the top-left corner of each chart.
* Blue line: "w/ Meaningless tokens"
* **Annotation (Bottom Row):** Shaded region labeled "Meaningless tokens" spans approximately from x=20 to x=70.
### Detailed Analysis
**Qwen2.5-7B-Math Layer 1 Head 22**
* **Top Chart:**
* Blue line (w/o Meaningless tokens): Fluctuates between 0.01 and 0.04 for the first 40 tokens, then increases to around 0.06 by token 60.
* Red line (w/ Meaningless tokens): Generally follows the blue line but is slightly higher, especially after token 40, reaching approximately 0.07.
* **Bottom Chart:**
* Blue line (w/ Meaningless tokens): Stays relatively low (around 0.01) until token 70, then increases sharply, reaching peaks around 0.06.
**Llama3.1-8B-Instruct Layer 1 Head 27**
* **Top Chart:**
* Blue line (w/o Meaningless tokens): Shows frequent fluctuations between 0.01 and 0.08.
* Red line (w/ Meaningless tokens): Similar to the blue line, but generally lower, staying mostly below 0.04.
* **Bottom Chart:**
* Blue line (w/ Meaningless tokens): Remains low (around 0.01-0.02) until token 70, then exhibits significant spikes, reaching up to 0.08.
**Gemma3-4b-it Layer 1 Head 3**
* **Top Chart:**
* Blue line (w/o Meaningless tokens): Relatively low and stable, mostly below 0.025.
* Red line (w/ Meaningless tokens): More volatile, with several peaks reaching up to 0.175 around token 50.
* **Bottom Chart:**
* Blue line (w/ Meaningless tokens): Very low until token 70, then spikes dramatically, reaching values as high as 0.16.
### Key Observations
* The presence of "meaningless" tokens appears to have a varying impact on the attention weights, depending on the model.
* In the top row, the red line (w/ Meaningless tokens) is sometimes higher (Qwen, Gemma) and sometimes lower (Llama) than the blue line (w/o Meaningless tokens).
* In all bottom charts, the attention weight with meaningless tokens is very low until the end of the "meaningless tokens" region (around token 70), after which it spikes significantly.
### Interpretation
The charts suggest that the models handle "meaningless" tokens differently. For Qwen and Gemma, including these tokens can increase the average attention weight, while for Llama, it might decrease it. The bottom row of charts indicates that the models tend to ignore these tokens initially, but their influence increases significantly after the region where they are present. This could imply that the models are designed to filter out or downweight these tokens during the initial processing stages, but their impact becomes more pronounced later in the sequence. The sudden spikes after the "meaningless tokens" region might indicate that the model is compensating for the earlier suppression of these tokens or that the context has shifted in a way that makes these tokens more relevant.