TECHNICAL ASSET FINGERPRINT
6e6f2eb18d1d702e539eb706
Click to view fullscreen
Press ESC or click to close
FOUND IN PAPERS
EXPERT: gemma-3-27b-it-free VERSION 1
RUNTIME: google-free/gemma-3-27b-it
INTEL_VERIFIED
\n
## Line Charts: Average Attention Weight vs. Token Position
### Overview
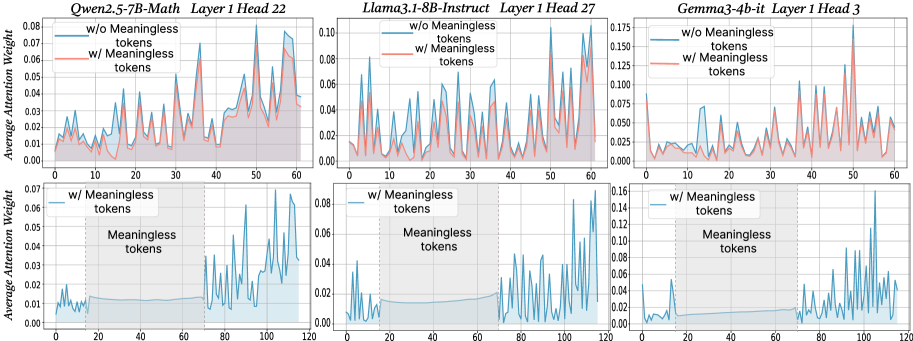
The image presents six line charts comparing the average attention weight with and without "meaningless tokens" for three different language models: Owen-2.5-7B-Math, Llama-3-8B-Instruct, and Gemma-3-4b-it. Each model is represented by two charts, one showing attention weights up to token position 60 and the other up to token position 120. The charts aim to visualize the impact of meaningless tokens on attention distribution.
### Components/Axes
* **X-axis:** Token Position (ranging from 0 to 60 in the top row and 0 to 120 in the bottom row).
* **Y-axis:** Average Attention Weight (ranging from 0 to approximately 0.08 for Owen, 0 to 0.10 for Llama, and 0 to 0.17 for Gemma).
* **Lines:**
* Blue Line: Represents the average attention weight *without* meaningless tokens ("w/o Meaningless tokens").
* Orange Line: Represents the average attention weight *with* meaningless tokens ("w/ Meaningless tokens").
* **Titles:** Each chart has a title indicating the model name, layer number, and head number.
* Owen-2.5-7B-Math Layer 1 Head 22
* Llama-3-8B-Instruct Layer 1 Head 27
* Gemma-3-4b-it Layer 1 Head 3
* **Legend:** Located in the top-left corner of each chart, clearly labeling the blue and orange lines.
### Detailed Analysis or Content Details
**Owen-2.5-7B-Math Layer 1 Head 22 (Top Left)**
* The blue line (w/o meaningless tokens) exhibits high-frequency oscillations, fluctuating between approximately 0.01 and 0.06.
* The orange line (w/ meaningless tokens) also oscillates, but with a generally lower average attention weight, mostly between 0.005 and 0.04.
* The trend is generally erratic for both lines, with no clear upward or downward slope.
* Approximate data points (blue line):
* Token 0: ~0.02
* Token 20: ~0.05
* Token 40: ~0.03
* Token 60: ~0.01
* Approximate data points (orange line):
* Token 0: ~0.01
* Token 20: ~0.02
* Token 40: ~0.01
* Token 60: ~0.005
**Llama-3-8B-Instruct Layer 1 Head 27 (Top Middle)**
* The blue line (w/o meaningless tokens) shows similar high-frequency oscillations as Owen, ranging from approximately 0.02 to 0.08.
* The orange line (w/ meaningless tokens) also oscillates, with a lower average attention weight, mostly between 0.01 and 0.05.
* The trend is erratic for both lines.
* Approximate data points (blue line):
* Token 0: ~0.04
* Token 20: ~0.06
* Token 40: ~0.04
* Token 60: ~0.02
* Approximate data points (orange line):
* Token 0: ~0.02
* Token 20: ~0.03
* Token 40: ~0.02
* Token 60: ~0.01
**Gemma-3-4b-it Layer 1 Head 3 (Top Right)**
* The blue line (w/o meaningless tokens) oscillates between approximately 0.03 and 0.15.
* The orange line (w/ meaningless tokens) oscillates between approximately 0.01 and 0.12.
* The trend is erratic for both lines.
* Approximate data points (blue line):
* Token 0: ~0.06
* Token 20: ~0.12
* Token 40: ~0.08
* Token 60: ~0.05
* Approximate data points (orange line):
* Token 0: ~0.02
* Token 20: ~0.06
* Token 40: ~0.04
* Token 60: ~0.03
**Owen-2.5-7B-Math Layer 1 Head 22 (Bottom Left)**
* The blue line (w/o meaningless tokens) oscillates between approximately 0.01 and 0.05.
* The orange line (w/ meaningless tokens) oscillates between approximately 0.005 and 0.04.
* The trend is erratic for both lines.
* Approximate data points (blue line):
* Token 0: ~0.02
* Token 40: ~0.03
* Token 80: ~0.02
* Token 120: ~0.01
* Approximate data points (orange line):
* Token 0: ~0.01
* Token 40: ~0.02
* Token 80: ~0.01
* Token 120: ~0.005
**Llama-3-8B-Instruct Layer 1 Head 27 (Bottom Middle)**
* The blue line (w/o meaningless tokens) oscillates between approximately 0.02 and 0.06.
* The orange line (w/ meaningless tokens) oscillates between approximately 0.01 and 0.04.
* The trend is erratic for both lines.
* Approximate data points (blue line):
* Token 0: ~0.03
* Token 40: ~0.04
* Token 80: ~0.03
* Token 120: ~0.02
* Approximate data points (orange line):
* Token 0: ~0.01
* Token 40: ~0.02
* Token 80: ~0.01
* Token 120: ~0.005
**Gemma-3-4b-it Layer 1 Head 3 (Bottom Right)**
* The blue line (w/o meaningless tokens) oscillates between approximately 0.04 and 0.14.
* The orange line (w/ meaningless tokens) oscillates between approximately 0.02 and 0.10.
* The trend is erratic for both lines.
* Approximate data points (blue line):
* Token 0: ~0.07
* Token 40: ~0.10
* Token 80: ~0.08
* Token 120: ~0.06
* Approximate data points (orange line):
* Token 0: ~0.03
* Token 40: ~0.06
* Token 80: ~0.04
* Token 120: ~0.03
### Key Observations
* In all charts, the attention weights with meaningless tokens are generally lower than those without.
* The attention weights exhibit high-frequency oscillations across all models and layers, suggesting a dynamic attention mechanism.
* Gemma-3-4b-it consistently shows higher average attention weights compared to Owen-2.5-7B-Math and Llama-3-8B-Instruct.
* The extended x-axis (up to 120 tokens) in the bottom row does not reveal any significantly different patterns compared to the top row (up to 60 tokens).
### Interpretation
The data suggests that the inclusion of meaningless tokens generally reduces the average attention weight across all three models. This indicates that the models are less focused on these tokens, which is expected. The high-frequency oscillations in attention weights suggest that the models are dynamically adjusting their attention based on the input sequence. The higher attention weights observed in Gemma-3-4b-it might indicate a more sensitive or complex attention mechanism. The lack of significant changes when extending the x-axis suggests that the attention patterns stabilize after a certain number of tokens. These charts provide insights into how different language models distribute their attention and how meaningless tokens affect this distribution. The erratic nature of the attention weights suggests that a more granular analysis, potentially involving averaging over larger datasets or examining specific token types, might be necessary to uncover more nuanced patterns.
DECODING INTELLIGENCE...