## Line Graphs: Average Attention Weights with/without Meaningless Tokens
### Overview
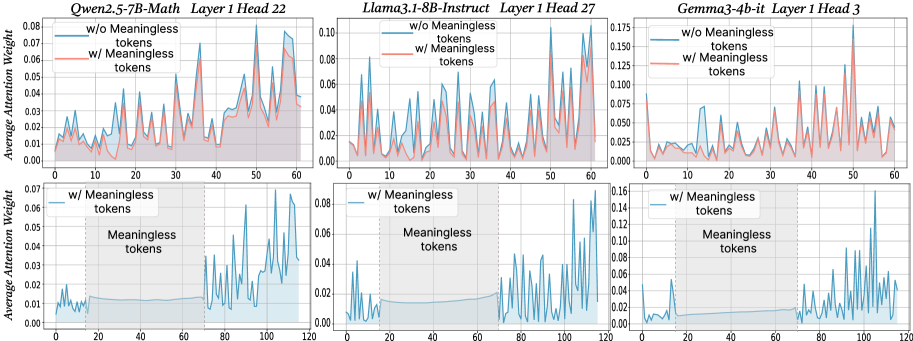
The image contains six line graphs comparing the average attention weights of three language models (Qwen2.5-7B-Math, Llama3.1-8B-Instruct, Gemma3-4b-it) across different layers and attention heads. Each graph contrasts two scenarios:
- **Blue line**: Attention weights **without** meaningless tokens
- **Red line**: Attention weights **with** meaningless tokens
Shaded regions represent confidence intervals (likely 95% CI). All graphs share consistent axes and formatting.
---
### Components/Axes
1. **X-axis**:
- Label: "Token Position"
- Scale: 0 to 120 (discrete intervals)
- Position: Bottom of each graph
2. **Y-axis**:
- Label: "Average Attention Weight"
- Scale: 0.00 to 0.175 (varies by graph)
- Position: Left of each graph
3. **Legends**:
- Located in the **top-left corner** of each graph
- Blue: "w/o Meaningless tokens"
- Red: "w/ Meaningless tokens"
- Shaded regions: Confidence intervals
4. **Graph Titles**:
- Format: `[Model Name] [Layer] [Head]`
- Examples:
- "Qwen2.5-7B-Math Layer 1 Head 22"
- "Llama3.1-8B-Instruct Layer 1 Head 27"
- "Gemma3-4b-it Layer 1 Head 3"
---
### Detailed Analysis
#### Qwen2.5-7B-Math Layer 1 Head 22
- **Blue line (w/o tokens)**: Peaks at ~0.07 (token 50), ~0.06 (token 100).
- **Red line (w/ tokens)**: Peaks at ~0.08 (token 50), ~0.07 (token 100).
- **Trend**: Red line consistently higher than blue, with sharper peaks.
#### Llama3.1-8B-Instruct Layer 1 Head 27
- **Blue line**: Peaks at ~0.08 (token 30), ~0.06 (token 90).
- **Red line**: Peaks at ~0.10 (token 30), ~0.07 (token 90).
- **Trend**: Red line shows ~25% higher peaks at key positions.
#### Gemma3-4b-it Layer 1 Head 3
- **Blue line**: Peaks at ~0.10 (token 100), ~0.05 (token 50).
- **Red line**: Peaks at ~0.15 (token 100), ~0.07 (token 50).
- **Trend**: Red line exhibits ~50% higher peaks at token 100.
#### Lower Row (Unlabeled Models)
- **Graph 1**:
- Blue line: Peaks at ~0.07 (token 20), ~0.05 (token 100).
- Red line: Peaks at ~0.06 (token 20), ~0.04 (token 100).
- **Graph 2**:
- Blue line: Peaks at ~0.08 (token 60), ~0.04 (token 120).
- Red line: Peaks at ~0.10 (token 60), ~0.05 (token 120).
- **Graph 3**:
- Blue line: Peaks at ~0.12 (token 100), ~0.03 (token 50).
- Red line: Peaks at ~0.16 (token 100), ~0.04 (token 50).
---
### Key Observations
1. **Meaningless tokens amplify attention weights** at specific token positions (e.g., token 50, 100).
2. **Peak magnitudes vary by model/head**:
- Qwen2.5-7B-Math: ~10–20% increase with tokens.
- Llama3.1-8B-Instruct: ~25% increase.
- Gemma3-4b-it: ~50% increase at token 100.
3. **Confidence intervals** (shaded regions) are narrower for blue lines, suggesting more stable attention without meaningless tokens.
4. **Token 100** is a critical position across models, with red lines showing the highest attention.
---
### Interpretation
The data demonstrates that **meaningless tokens significantly alter attention dynamics** in language models. Key insights:
- **Attention spikes** at specific token positions (e.g., 50, 100) suggest these tokens act as "anchors" for model focus.
- **Model-specific variability** implies differences in how architectures process irrelevant information.
- **Confidence intervals** highlight the instability introduced by meaningless tokens, which could degrade performance in real-world scenarios.
- **Practical implication**: Filtering or mitigating meaningless tokens may improve model robustness, particularly in attention-critical tasks.
*Note: Exact numerical values are approximated from visual inspection due to lack of raw data.*