# Technical Data Extraction: RSA Step Performance Analysis
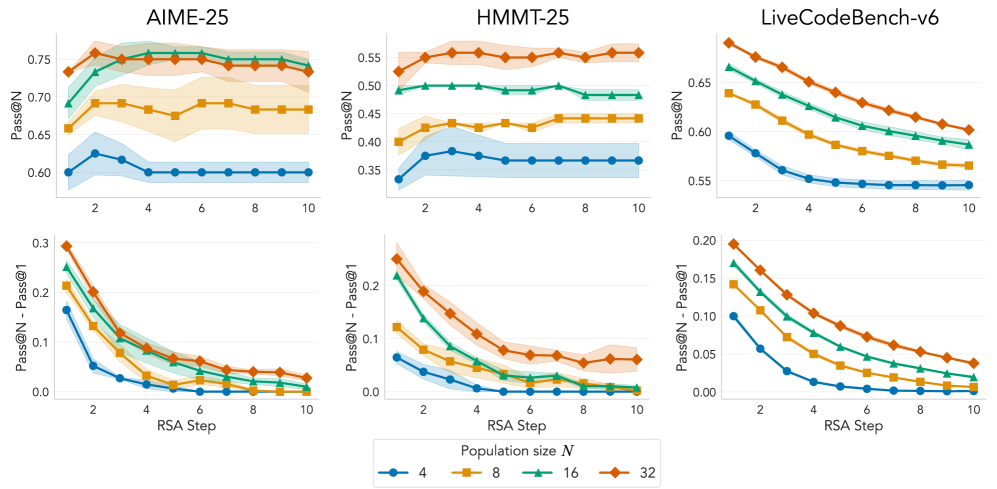
This document provides a comprehensive extraction of data and trends from the provided image, which consists of six line charts organized in a 2x3 grid. The charts evaluate the performance of a model across three benchmarks (AIME-25, HMMT-25, and LiveCodeBench-v6) using two different metrics (Pass@N and Pass@N - Pass@1) over 10 RSA Steps.
## 1. Global Metadata and Legend
* **Language:** English
* **X-Axis (All Charts):** RSA Step (Values: 1, 2, 3, 4, 5, 6, 7, 8, 9, 10)
* **Legend (Bottom Center):** Population size $N$
* **Blue Circle (●):** $N = 4$
* **Yellow Square (■):** $N = 8$
* **Green Triangle (▲):** $N = 16$
* **Orange Diamond (◆):** $N = 32$
* **Visual Features:** Each line includes a shaded area representing a confidence interval or variance around the mean.
---
## 2. Row 1: Pass@N Performance
This row measures the absolute Pass@N score. Higher values indicate better performance.
### A. AIME-25 (Top-Left)
* **Y-Axis:** Pass@N (Range: 0.60 to 0.75+)
* **Trends:**
* **$N=32$ (Orange):** Starts high (~0.73), peaks at step 2 (~0.76), then stabilizes with a slight decline toward step 10 (~0.73).
* **$N=16$ (Green):** Shows strong upward growth from step 1 (~0.69) to step 4 (~0.75), then plateaus.
* **$N=8$ (Yellow):** Increases from step 1 (~0.66) to step 2 (~0.69), then remains relatively flat with minor fluctuations around 0.68-0.69.
* **$N=4$ (Blue):** Lowest performance. Peaks at step 2 (~0.63) and then drops to a flat line at 0.60 from step 4 onwards.
### B. HMMT-25 (Top-Middle)
* **Y-Axis:** Pass@N (Range: 0.35 to 0.55+)
* **Trends:**
* **$N=32$ (Orange):** Highest performance. Trends upward from step 1 (~0.52) to step 3 (~0.56) and maintains a high plateau around 0.55-0.56.
* **$N=16$ (Green):** Stable performance. Starts at ~0.49 and maintains a very flat trajectory, ending slightly lower at ~0.48.
* **$N=8$ (Yellow):** Gradual upward trend. Starts at 0.40 and climbs steadily to ~0.44 by step 10.
* **$N=4$ (Blue):** Starts at ~0.33, peaks at step 3 (~0.38), then stabilizes around 0.37.
### C. LiveCodeBench-v6 (Top-Right)
* **Y-Axis:** Pass@N (Range: 0.55 to 0.70+)
* **Trends:**
* **General Trend:** Unlike the other benchmarks, all population sizes show a **downward trend** as RSA steps increase.
* **$N=32$ (Orange):** Drops from ~0.69 (Step 1) to ~0.60 (Step 10).
* **$N=16$ (Green):** Drops from ~0.67 (Step 1) to ~0.58 (Step 10).
* **$N=8$ (Yellow):** Drops from ~0.64 (Step 1) to ~0.56 (Step 10).
* **$N=4$ (Blue):** Drops from ~0.59 (Step 1) to ~0.54 (Step 10).
---
## 3. Row 2: Pass@N - Pass@1 (Relative Improvement)
This row measures the gain in performance relative to the first step. A value of 0.0 indicates no improvement over the baseline.
### A. AIME-25 (Bottom-Left)
* **Y-Axis:** Pass@N - Pass@1 (Range: 0.0 to 0.3)
* **Trends:** All series show a sharp exponential decay.
* **$N=32$ (Orange):** Highest initial gain (~0.29), dropping to ~0.03 by step 10.
* **$N=4$ (Blue):** Lowest initial gain (~0.16), dropping to 0.0 by step 5 and remaining there.
### B. HMMT-25 (Bottom-Middle)
* **Y-Axis:** Pass@N - Pass@1 (Range: 0.0 to 0.2+)
* **Trends:**
* **$N=32$ (Orange):** Starts at ~0.25, decays to ~0.06. It maintains the highest relative gain throughout.
* **$N=16$ (Green) & $N=8$ (Yellow):** Both start between 0.12 and 0.22 and converge toward 0.0 by step 10.
* **$N=4$ (Blue):** Starts at ~0.07, hits 0.0 by step 6.
### C. LiveCodeBench-v6 (Bottom-Right)
* **Y-Axis:** Pass@N - Pass@1 (Range: 0.0 to 0.20)
* **Trends:** Consistent decay across all population sizes.
* **$N=32$ (Orange):** Starts at ~0.19, ends at ~0.04.
* **$N=16$ (Green):** Starts at ~0.17, ends at ~0.02.
* **$N=8$ (Yellow):** Starts at ~0.14, ends at ~0.01.
* **$N=4$ (Blue):** Starts at ~0.10, reaches 0.0 by step 7.
---
## 4. Summary of Observations
1. **Scaling:** In all benchmarks, a larger population size ($N=32$) consistently outperforms smaller sizes ($N=4$).
2. **RSA Step Impact:**
* For **AIME-25** and **HMMT-25**, increasing RSA steps generally improves or maintains performance (Pass@N) up to a certain point (usually step 2-4).
* For **LiveCodeBench-v6**, increasing RSA steps is detrimental to absolute performance (Pass@N), showing a consistent decline.
3. **Diminishing Returns:** The "Pass@N - Pass@1" charts confirm that the marginal benefit of additional RSA steps decreases rapidly, typically converging toward zero or a low baseline after 6-8 steps.