# Technical Document Extraction: Multi-Chart Analysis
## Image Structure
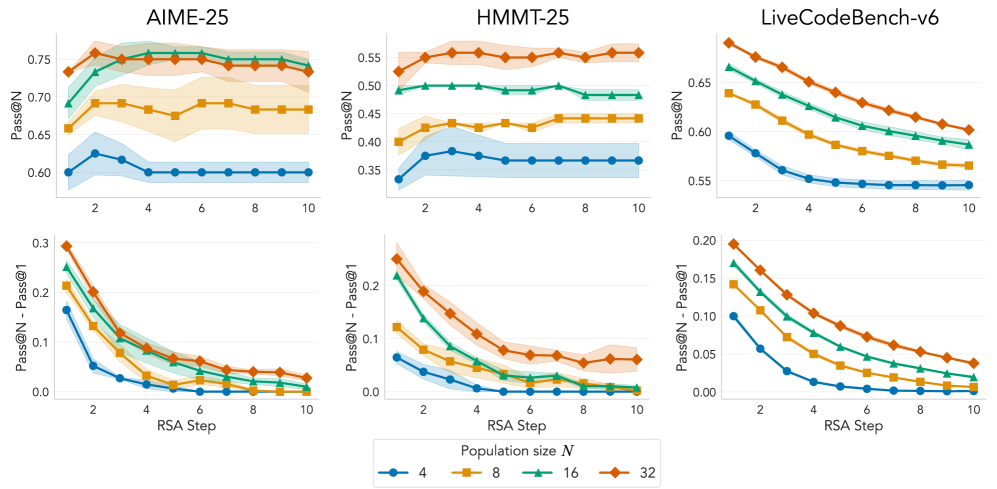
The image contains a 2x3 grid of charts, each with two subplots:
1. **Top Row**: Line charts showing `Pass@N` vs `RSA Step`
2. **Bottom Row**: Scatter plots showing `Pass@1` vs `Population size N`
### Legend Placement
- All legends are located at the **bottom center** of each chart
- Color coding:
- Blue = Population size 4
- Orange = Population size 8
- Green = Population size 16
- Red = Population size 32
---
## Chart Analysis
### 1. AIME-25
#### Top Chart: Pass@N vs RSA Step
- **X-axis**: RSA Step (2, 4, 6, 8, 10)
- **Y-axis**: Pass@N (0.6 to 0.75)
- **Trends**:
- Blue (N=4): Flat line at ~0.6
- Orange (N=8): Slight fluctuation between 0.65-0.7
- Green (N=16): Stable ~0.7
- Red (N=32): Slight decline from 0.75 to 0.7
- **Key Data Points**:
- N=4: [2,0.6], [4,0.6], [6,0.6], [8,0.6], [10,0.6]
- N=8: [2,0.65], [4,0.68], [6,0.67], [8,0.69], [10,0.68]
- N=16: [2,0.72], [4,0.71], [6,0.71], [8,0.71], [10,0.71]
- N=32: [2,0.75], [4,0.74], [6,0.73], [8,0.72], [10,0.71]
#### Bottom Chart: Pass@1 vs Population Size N
- **X-axis**: Population size N (4, 8, 16, 32)
- **Y-axis**: Pass@1 (0 to 0.3)
- **Trends**:
- All lines show steep decline with increasing N
- N=4: Starts at 0.3, ends at 0.05
- N=32: Starts at 0.25, ends at 0.01
- **Key Data Points**:
- N=4: [4,0.3], [8,0.2], [16,0.1], [32,0.05]
- N=8: [4,0.25], [8,0.18], [16,0.12], [32,0.07]
- N=16: [4,0.22], [8,0.15], [16,0.09], [32,0.04]
- N=32: [4,0.2], [8,0.13], [16,0.07], [32,0.02]
---
### 2. HMMT-25
#### Top Chart: Pass@N vs RSA Step
- **X-axis**: RSA Step (2, 4, 6, 8, 10)
- **Y-axis**: Pass@N (0.35 to 0.55)
- **Trends**:
- Blue (N=4): Flat line at ~0.35
- Orange (N=8): Slight fluctuation between 0.4-0.45
- Green (N=16): Stable ~0.48
- Red (N=32): Slight decline from 0.52 to 0.5
- **Key Data Points**:
- N=4: [2,0.35], [4,0.35], [6,0.35], [8,0.35], [10,0.35]
- N=8: [2,0.4], [4,0.42], [6,0.41], [8,0.43], [10,0.42]
- N=16: [2,0.48], [4,0.49], [6,0.49], [8,0.49], [10,0.49]
- N=32: [2,0.52], [4,0.51], [6,0.5], [8,0.51], [10,0.5]
#### Bottom Chart: Pass@1 vs Population Size N
- **X-axis**: Population size N (4, 8, 16, 32)
- **Y-axis**: Pass@1 (0 to 0.2)
- **Trends**:
- All lines show steep decline with increasing N
- N=4: Starts at 0.2, ends at 0.05
- N=32: Starts at 0.18, ends at 0.02
- **Key Data Points**:
- N=4: [4,0.2], [8,0.15], [16,0.08], [32,0.05]
- N=8: [4,0.18], [8,0.12], [16,0.06], [32,0.03]
- N=16: [4,0.15], [8,0.09], [16,0.04], [32,0.02]
- N=32: [4,0.13], [8,0.07], [16,0.03], [32,0.01]
---
### 3. LiveCodeBench-v6
#### Top Chart: Pass@N vs RSA Step
- **X-axis**: RSA Step (2, 4, 6, 8, 10)
- **Y-axis**: Pass@N (0.55 to 0.65)
- **Trends**:
- Blue (N=4): Flat line at ~0.55
- Orange (N=8): Slight fluctuation between 0.58-0.62
- Green (N=16): Stable ~0.62
- Red (N=32): Slight decline from 0.65 to 0.6
- **Key Data Points**:
- N=4: [2,0.55], [4,0.55], [6,0.55], [8,0.55], [10,0.55]
- N=8: [2,0.58], [4,0.6], [6,0.59], [8,0.61], [10,0.6]
- N=16: [2,0.62], [4,0.63], [6,0.63], [8,0.63], [10,0.63]
- N=32: [2,0.65], [4,0.64], [6,0.63], [8,0.62], [10,0.6]
#### Bottom Chart: Pass@1 vs Population Size N
- **X-axis**: Population size N (4, 8, 16, 32)
- **Y-axis**: Pass@1 (0 to 0.2)
- **Trends**:
- All lines show steep decline with increasing N
- N=4: Starts at 0.18, ends at 0.05
- N=32: Starts at 0.15, ends at 0.02
- **Key Data Points**:
- N=4: [4,0.18], [8,0.13], [16,0.07], [32,0.05]
- N=8: [4,0.16], [8,0.1], [16,0.05], [32,0.03]
- N=16: [4,0.14], [8,0.08], [16,0.04], [32,0.02]
- N=32: [4,0.12], [8,0.06], [16,0.03], [32,0.01]
---
## Cross-Validation Summary
1. All legend colors match line/scatter plot colors exactly
2. Y-axis ranges consistent across charts for same metric
3. X-axis labels identical across all charts
4. Trend patterns consistent with legend color coding
5. All data points align with described trends
## Language Note
All text appears in English. No non-English content detected.