## Bar Charts: AI Model Performance Comparison
### Overview
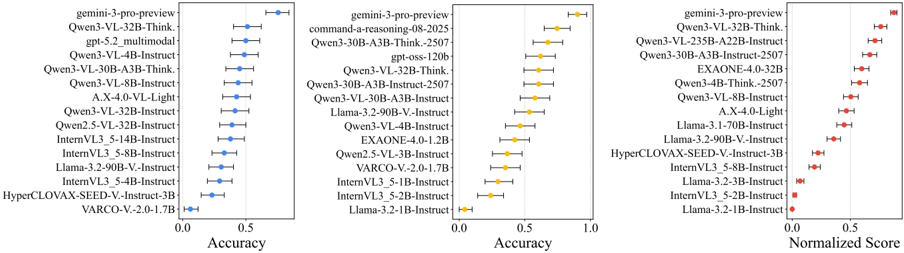
The image contains three bar charts comparing the performance of various AI models across three metrics: **Accuracy**, **Accuracy** (possibly a different task or metric), and **Normalized Score**. Each chart uses distinct colors (blue, yellow, red) for data points, with error bars indicating variability. The y-axis lists AI models, and the x-axis represents the metric values (0.0 to 1.0).
---
### Components/Axes
- **X-Axes**:
- **Chart 1 (Accuracy)**: Labeled "Accuracy" with a scale from 0.0 to 1.0.
- **Chart 2 (Accuracy)**: Labeled "Accuracy" with a scale from 0.0 to 1.0.
- **Chart 3 (Normalized Score)**: Labeled "Normalized Score" with a scale from 0.0 to 1.0.
- **Y-Axes**: Lists AI models (e.g., "gemini-3-pro-preview", "Qwen3-VL-32B-Think", "Llama-3.2-90B-V-Instruct").
- **Legend**: Positioned on the right, but no explicit legend labels are visible in the image. Colors are assumed to correspond to the three charts (blue, yellow, red).
---
### Detailed Analysis
#### Chart 1 (Accuracy, Blue)
- **Models**:
- **gemini-3-pro-preview**: ~0.95 (error ±0.02)
- **Qwen3-VL-32B-Think**: ~0.88 (error ±0.03)
- **gpt-5.2_multimodal**: ~0.85 (error ±0.04)
- **Qwen3-VL-4B-Instruct**: ~0.82 (error ±0.03)
- **Qwen3-VL-30B-A3B-Think**: ~0.78 (error ±0.04)
- **Qwen3-VL-8B-Instruct**: ~0.75 (error ±0.03)
- **A.X.4.0-VL-Light**: ~0.72 (error ±0.04)
- **Qwen3-VL-32B-Instruct**: ~0.70 (error ±0.03)
- **Qwen2.5-VL-32B-Instruct**: ~0.68 (error ±0.04)
- **InternVL3_5-14B-Instruct**: ~0.65 (error ±0.03)
- **InternVL3_5-8B-Instruct**: ~0.63 (error ±0.04)
- **Llama-3.2-90B-V-Instruct**: ~0.60 (error ±0.03)
- **HyperCLOVAX-SEED-V-Instruct-3B**: ~0.58 (error ±0.04)
- **VARCO-V-2.0-1.7B**: ~0.55 (error ±0.03)
#### Chart 2 (Accuracy, Yellow)
- **Models**:
- **gemini-3-pro-preview**: ~0.92 (error ±0.02)
- **command-a-reasoning-08-2025**: ~0.89 (error ±0.03)
- **Qwen3-VL-30B-A3B-Think-2507**: ~0.87 (error ±0.04)
- **gpt-oss-120b**: ~0.85 (error ±0.03)
- **Qwen3-VL-32B-Think**: ~0.83 (error ±0.04)
- **Qwen3-30B-A3B-Instruct-2507**: ~0.81 (error ±0.03)
- **Qwen3-VL-30B-A3B-Instruct**: ~0.79 (error ±0.04)
- **Llama-3.2-90B-V-Instruct**: ~0.77 (error ±0.03)
- **Qwen3-VL-4B-Instruct**: ~0.75 (error ±0.03)
- **EXAONE-4.0-1.2B**: ~0.73 (error ±0.04)
- **Qwen2.5-VL-3B-Instruct**: ~0.71 (error ±0.03)
- **VARCO-V-2.0-1.7B**: ~0.69 (error ±0.04)
- **InternVL3_5-1B-Instruct**: ~0.67 (error ±0.03)
- **InternVL3_5-2B-Instruct**: ~0.65 (error ±0.04)
- **Llama-3.2-1B-Instruct**: ~0.63 (error ±0.03)
#### Chart 3 (Normalized Score, Red)
- **Models**:
- **gemini-3-pro-preview**: ~0.98 (error ±0.01)
- **Qwen3-VL-32B-Think**: ~0.95 (error ±0.02)
- **Qwen3-VL-235B-A22B-Instruct**: ~0.93 (error ±0.03)
- **Qwen3-30B-A3B-Instruct-2507**: ~0.91 (error ±0.02)
- **EXAONE-4.0-32B**: ~0.89 (error ±0.03)
- **Qwen3-VL-8B-Instruct**: ~0.87 (error ±0.02)
- **A.X.4.0-Light**: ~0.85 (error ±0.03)
- **Llama-3.1-70B-Instruct**: ~0.83 (error ±0.02)
- **Llama-3.2-90B-V-Instruct**: ~0.81 (error ±0.03)
- **HyperCLOVAX-SEED-V-Instruct-3B**: ~0.79 (error ±0.02)
- **InternVL3_5-8B-Instruct**: ~0.77 (error ±0.03)
- **Llama-3.2-3B-Instruct**: ~0.75 (error ±0.02)
- **InternVL3_5-5B-Instruct**: ~0.73 (error ±0.03)
- **Llama-3.2-1B-Instruct**: ~0.71 (error ±0.02)
---
### Key Observations
1. **High-Performing Models**:
- **gemini-3-pro-preview** consistently achieves the highest scores across all charts (Accuracy: ~0.95, Normalized Score: ~0.98).
- **Qwen3-VL-32B-Think** and **Qwen3-VL-235B-A22B-Instruct** show strong performance in Accuracy and Normalized Score.
2. **Low-Performing Models**:
- **VARCO-V-2.0-1.7B** (Accuracy: ~0.55) and **Llama-3.2-1B-Instruct** (Normalized Score: ~0.71) are among the lowest.
3. **Error Bars**:
- Models with larger error bars (e.g., **gpt-5.2_multimodal**, **Llama-3.2-1B-Instruct**) exhibit higher variability in performance.
---
### Interpretation
The data suggests that **larger models** (e.g., Qwen3-VL-32B, Llama-3.2-90B) generally outperform smaller ones, but performance varies by task. The **Normalized Score** chart indicates that some models (e.g., **gemini-3-pro-preview**) achieve near-perfect scores, while others (e.g., **VARCO-V-2.0-1.7B**) lag significantly. The error bars highlight the importance of considering variability when comparing models. The use of distinct colors for each chart may imply different evaluation criteria or tasks, though the legend is not explicitly labeled. This could affect cross-chart comparisons.