## Character Grid: Binary Representation with Markers
### Overview
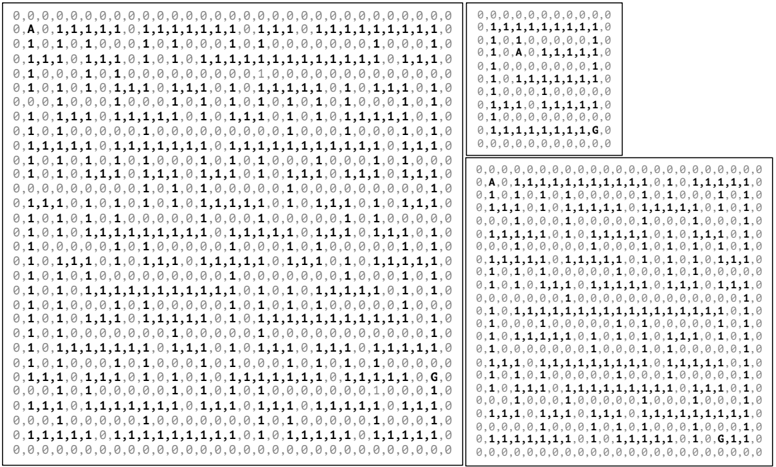
The image presents three grids of binary data (0s and 1s), each with dimensions approximately 20x30. The grids are enclosed in boxes. The top-left grid and the bottom grid contain the letter "A" in the second row and the letter "G" near the bottom. The top-right grid also contains "A" and "G".
### Components/Axes
* **Grid Cells:** Each cell contains either a "0" or a "1".
* **Markers:** The letters "A" and "G" are present in specific cells within the grids.
* **Grid Boundaries:** Each grid is enclosed within a rectangular border.
### Detailed Analysis or ### Content Details
**Grid 1 (Top-Left):**
* Dimensions: Approximately 20 rows x 31 columns.
* Top Row: All "0"s.
* Second Row: "0,A,0,1,1,1,1,1,0,1,1,1,1,1,1,1,0,1,1,1,0,1,1,1,1,1,1,1,1,1,0"
* Bottom Row: All "0"s.
* Letter "A": Located at position (2,2).
* Letter "G": Located near the bottom-right. The row containing "G" reads "...1,1,1,0,G,0".
**Grid 2 (Top-Right):**
* Dimensions: Approximately 10 rows x 20 columns.
* Top Row: All "0"s.
* Second Row: "0,A,0,1,1,1,1,1,0"
* Bottom Row: All "0"s.
* Letter "A": Located at position (2,2).
* Letter "G": Located near the bottom-right. The row containing "G" reads "...1,1,1,1,G,0".
**Grid 3 (Bottom):**
* Dimensions: Approximately 20 rows x 31 columns.
* Top Row: All "0"s.
* Second Row: "0,A,0,1,1,1,1,1,1,1,1,1,1,1,0,1,0,1,1,1,1,1,0"
* Bottom Row: All "0"s.
* Letter "A": Located at position (2,2).
* Letter "G": Located near the bottom-right. The row containing "G" reads "...1,1,1,1,1,0,G,1,1,0".
### Key Observations
* All grids start and end with rows of "0"s.
* The letter "A" consistently appears in the second row, second column of each grid.
* The letter "G" appears near the bottom-right corner of each grid.
* The majority of the grid cells contain "1"s, with "0"s sparsely distributed.
### Interpretation
The image likely represents a binary encoding of some data, possibly characters or other information. The "A" and "G" markers could indicate the start and end points of a specific data sequence or represent some other form of metadata within the encoding. The grids may represent different segments or versions of the same underlying data. The high density of "1"s suggests a specific encoding scheme where "1" is the dominant bit value.