## Data Matrix Diagram: Binary Grid with Annotations
### Overview
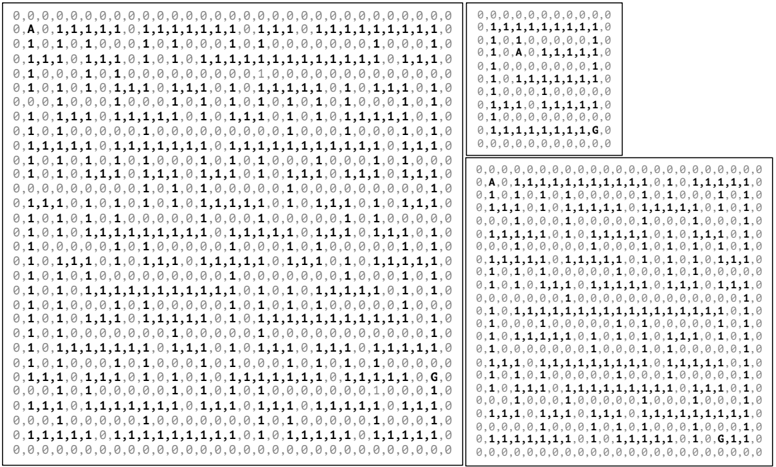
The image displays three separate rectangular grids containing binary data (0s and 1s) with occasional alphabetic annotations ('A' and 'G'). The grids are arranged with one large grid on the left and two smaller grids stacked vertically on the right. The overall presentation suggests a visualization of encoded data, possibly representing a matrix, a bitboard, or a spatial mapping where '1's indicate presence or activation and '0's indicate absence or inactivity. The letters 'A' and 'G' appear as specific markers within the data fields.
### Components/Axes
* **Structure:** Three distinct grids.
* **Left Grid:** Large, approximately square.
* **Top-Right Grid:** Smaller, rectangular (wider than tall).
* **Bottom-Right Grid:** Smaller, rectangular (wider than tall), similar in size to the top-right grid.
* **Content:** Each grid is composed of rows and columns of characters. The primary characters are the digits '0' and '1'. The letters 'A' and 'G' appear sporadically.
* **Labels/Axes:** There are no explicit axis labels, titles, or legends. The grids themselves are the data.
* **Spatial Grounding:**
* The **'A'** in the **Left Grid** is located in the top-left corner (Row 1, Column 2).
* The **'G'** in the **Left Grid** is located in the bottom-right corner (second to last row, second to last column).
* The **'A'** in the **Top-Right Grid** is located in the top-left area (Row 3, Column 8).
* The **'G'** in the **Top-Right Grid** is located in the bottom-right corner (second to last row, second to last column).
* The **'A'** in the **Bottom-Right Grid** is located in the top-left corner (Row 1, Column 2).
* The **'G'** in the **Bottom-Right Grid** is located in the bottom-right corner (second to last row, second to last column).
### Detailed Analysis
**1. Left Grid (Large):**
* **Dimensions:** Approximately 25 rows by 25 columns.
* **Content Pattern:** The grid shows a complex, non-uniform distribution of 1s and 0s. There are clusters and lines of 1s, suggesting structured data rather than random noise.
* **Annotations:**
* **'A'**: Positioned at (Row 1, Column 2). The sequence in that row begins: `0 A 0 1 1 1 1 1 0 0 0 0 0 0 0 0 1 1 1 1 1 1 1 1 1 1`.
* **'G'**: Positioned near the bottom-right. The sequence in that row begins: `1 1 1 1 1 1 1 1 1 1 1 1 1 1 1 1 1 1 1 1 1 1 1 G 1 1`.
**2. Top-Right Grid:**
* **Dimensions:** Approximately 10 rows by 15 columns.
* **Content Pattern:** Similar binary structure to the left grid but on a smaller scale.
* **Annotations:**
* **'A'**: Positioned at (Row 3, Column 8). The sequence in that row is: `0 0 1 0 1 0 1 0 A 0 1 1 1 1 1`.
* **'G'**: Positioned at the bottom-right. The sequence in the last row is: `0 0 0 0 0 0 0 0 0 0 0 0 1 G 0`.
**3. Bottom-Right Grid:**
* **Dimensions:** Approximately 20 rows by 25 columns.
* **Content Pattern:** Another complex binary matrix.
* **Annotations:**
* **'A'**: Positioned at (Row 1, Column 2). The sequence in that row is: `0 A 0 1 1 1 1 1 1 1 1 1 1 1 1 1 1 1 1 1 1 1 1 1 1`.
* **'G'**: Positioned at the bottom-right. The sequence in the last row is: `1 1 1 1 1 1 1 1 1 1 1 1 1 1 1 1 1 1 1 1 1 1 1 G 1 1`.
### Key Observations
1. **Consistent Marker Placement:** In all three grids, the letter 'A' is consistently placed in the top-left region (specifically, the second column of the first or an early row). The letter 'G' is consistently placed in the bottom-right region (specifically, the second-to-last column of the second-to-last or last row).
2. **Binary Data Structure:** The 1s and 0s form intricate, non-random patterns. There are visible horizontal and vertical lines of 1s, suggesting the data may represent connections, pathways, or a spatial map (e.g., a circuit layout, a neural network weight matrix, or a genomic sequence alignment).
3. **Grid Relationships:** The two smaller grids on the right may be subsets, zoomed-in sections, or related datasets to the larger grid on the left. Their similar annotation pattern supports this.
### Interpretation
This image is a technical visualization of binary data matrices. The consistent placement of 'A' and 'G' suggests they are **anchor points or reference markers** within the data fields, possibly denoting start/end points, specific features, or coordinates in a larger system.
* **What the data suggests:** The structured patterns of 1s imply relationships or connections. This could be a visualization of:
* A **sparse matrix** from computational science.
* A **bitboard** used in chess programming or game theory.
* A **connectivity map** for a network or grid-based system.
* An **alignment or comparison** of sequences (where 'A' and 'G' could represent nucleotide bases in genetics, though the binary context is atypical).
* **How elements relate:** The three grids likely represent different views or scales of the same underlying data system. The large grid provides an overview, while the smaller grids may focus on specific regions of interest defined by the 'A' and 'G' markers.
* **Notable anomalies:** The primary anomaly is the presence of alphabetic characters in a purely binary field. Their consistent positional logic (top-left 'A', bottom-right 'G') is the most significant pattern, indicating a designed coordinate system or labeling convention within the data structure itself. The exact meaning of 'A' and 'G' is not defined within the image and would require external context.