## Binary Matrix with Embedded Annotations
### Overview
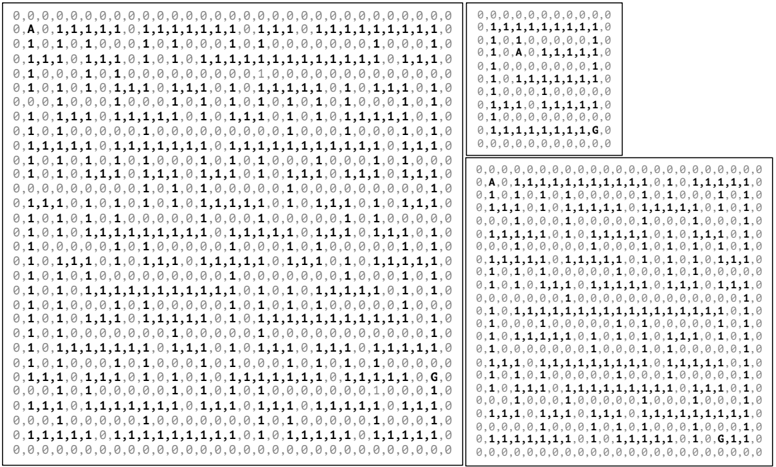
The image displays a large grid composed of binary digits (0s and 1s) organized into three distinct sections: a dominant left section, a smaller top-right section, and a larger bottom-right section. Scattered throughout the grid are alphanumeric annotations ("A" and "G") embedded within specific cells. The grid lacks explicit axes, legends, or numerical labels beyond the binary values.
### Components/Axes
- **Grid Structure**:
- **Left Section**: 20 rows × 30 columns of binary data.
- **Top-Right Section**: 5 rows × 10 columns of binary data.
- **Bottom-Right Section**: 15 rows × 20 columns of binary data.
- **Annotations**:
- **"A"**: Appears in the first row of the left section (column 2) and the top-right section (row 5, column 10).
- **"G"**: Appears in the bottom-right section (row 15, column 20).
### Detailed Analysis
- **Binary Patterns**:
- The left section exhibits repetitive sequences of "1,1,1,1" and "0,0,0,0" in rows 2–19, suggesting structured data blocks.
- The top-right and bottom-right sections show less repetition, with sporadic "1" and "0" distributions.
- **Annotation Placement**:
- "A" and "G" are positioned at the edges of their respective sections, potentially marking boundaries or key data points.
- No other alphanumeric characters are present.
### Key Observations
1. **Structural Segmentation**: The grid is divided into three logical regions, each with distinct binary patterns.
2. **Sparse Annotations**: Only two unique letters ("A" and "G") are embedded, with no clear correlation to binary values.
3. **Repetition vs. Randomness**: The left section shows higher repetition, while the right sections appear more randomized.
### Interpretation
The grid likely represents a binary dataset with embedded markers ("A" and "G") to denote specific events, categories, or anomalies. The segmentation into sections suggests modular data organization, possibly for processing or analysis. The lack of explicit labels or legends implies the annotations are self-referential or context-dependent within the dataset. The repetition in the left section may indicate a controlled or standardized data block, while the right sections could represent variable or unstructured data. The placement of "A" and "G" at section boundaries might signify transitions or critical thresholds in the data flow.