\n
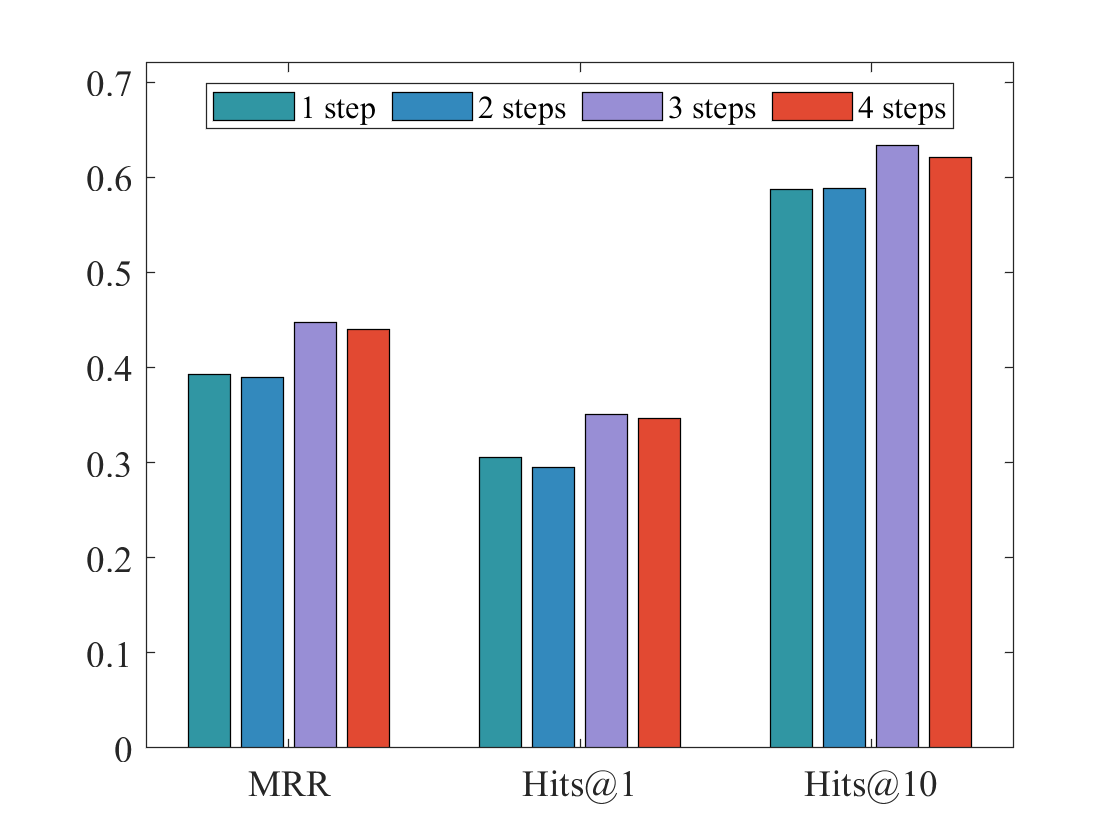
## Bar Chart: Performance Comparison by Step Count
### Overview
This image presents a bar chart comparing the performance of a system across different metrics (MRR, Hits@1, Hits@10) as a function of the number of steps taken (1, 2, 3, and 4). The chart uses colored bars to represent each step count for each metric.
### Components/Axes
* **X-axis:** Represents the evaluation metrics: "MRR", "Hits@1", and "Hits@10".
* **Y-axis:** Represents the performance score, ranging from 0.0 to 0.7, with increments of 0.1.
* **Legend (Top-Center):**
* Light Blue: "1 step"
* Medium Blue: "2 steps"
* Light Purple: "3 steps"
* Red: "4 steps"
### Detailed Analysis
The chart consists of three groups of bars, one for each metric. Within each group, there are four bars representing the performance at 1, 2, 3, and 4 steps.
**MRR (Mean Reciprocal Rank):**
* 1 step: Approximately 0.39
* 2 steps: Approximately 0.41
* 3 steps: Approximately 0.44
* 4 steps: Approximately 0.46
*Trend:* The bars show an upward trend, indicating that MRR increases with the number of steps.
**Hits@1 (Hit Rate at Rank 1):**
* 1 step: Approximately 0.29
* 2 steps: Approximately 0.30
* 3 steps: Approximately 0.32
* 4 steps: Approximately 0.34
*Trend:* The bars show an upward trend, indicating that Hits@1 increases with the number of steps.
**Hits@10 (Hit Rate at Rank 10):**
* 1 step: Approximately 0.58
* 2 steps: Approximately 0.59
* 3 steps: Approximately 0.61
* 4 steps: Approximately 0.63
*Trend:* The bars show an upward trend, indicating that Hits@10 increases with the number of steps.
### Key Observations
* All metrics show a positive correlation with the number of steps. Increasing the number of steps consistently improves performance.
* The improvement in Hits@10 is more pronounced than the improvement in MRR or Hits@1.
* The difference in performance between 1 step and 2 steps is smaller than the difference between 3 steps and 4 steps for all metrics.
### Interpretation
The data suggests that increasing the number of steps in the system leads to improved performance across all evaluated metrics. This could indicate that the system benefits from more iterations or refinement. The larger improvement observed in Hits@10 suggests that the system is better at identifying relevant results within the top 10 recommendations as the number of steps increases. The non-linear improvement (smaller gains initially, larger gains later) might indicate diminishing returns or a threshold effect where additional steps become more impactful after a certain point. The chart demonstrates a clear trade-off between computational cost (more steps) and performance. Further investigation could explore the optimal number of steps to balance performance gains with computational efficiency.