## Grouped Bar Chart: Performance Metrics by Step Count
### Overview
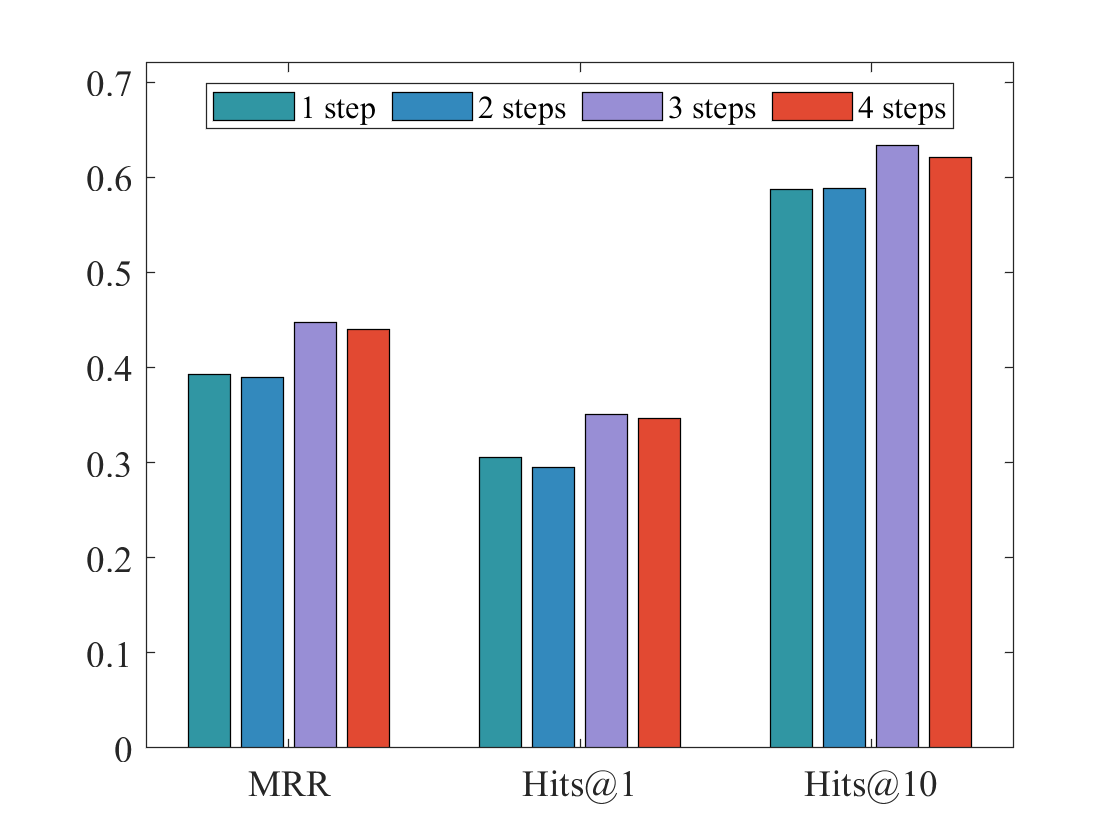
The image displays a grouped bar chart comparing three performance metrics (MRR, Hits@1, Hits@10) across four different step counts (1 step, 2 steps, 3 steps, 4 steps). The chart illustrates how model performance varies with the number of steps for each evaluation metric.
### Components/Axes
* **Chart Type:** Grouped Bar Chart.
* **Y-Axis:** Numerical scale ranging from 0 to 0.7, with major tick marks at intervals of 0.1 (0, 0.1, 0.2, 0.3, 0.4, 0.5, 0.6, 0.7). The axis label is not explicitly stated but represents the score or value of the performance metrics.
* **X-Axis:** Categorical axis with three primary groups: "MRR", "Hits@1", and "Hits@10".
* **Legend:** Positioned at the top-center of the chart area. It defines four data series by color:
* Teal bar: "1 step"
* Blue bar: "2 steps"
* Light purple bar: "3 steps"
* Red-orange bar: "4 steps"
### Detailed Analysis
The chart presents the following approximate values for each metric and step count. Values are estimated based on bar height relative to the y-axis grid.
**1. MRR (Mean Reciprocal Rank) Group:**
* **1 step (Teal):** ~0.39
* **2 steps (Blue):** ~0.39
* **3 steps (Light Purple):** ~0.45
* **4 steps (Red-Orange):** ~0.44
* **Trend:** Performance is similar for 1 and 2 steps, increases noticeably for 3 steps, and shows a very slight decrease for 4 steps.
**2. Hits@1 Group:**
* **1 step (Teal):** ~0.305
* **2 steps (Blue):** ~0.295
* **3 steps (Light Purple):** ~0.35
* **4 steps (Red-Orange):** ~0.345
* **Trend:** Performance dips slightly from 1 to 2 steps, then increases for 3 steps, followed by a marginal decrease for 4 steps. This group has the lowest overall values.
**3. Hits@10 Group:**
* **1 step (Teal):** ~0.59
* **2 steps (Blue):** ~0.59
* **3 steps (Light Purple):** ~0.635
* **4 steps (Red-Orange):** ~0.62
* **Trend:** Performance is identical for 1 and 2 steps, peaks at 3 steps, and decreases slightly for 4 steps. This group has the highest overall values.
### Key Observations
1. **Consistent Peak at 3 Steps:** For all three metrics (MRR, Hits@1, Hits@10), the highest performance is achieved with "3 steps".
2. **Performance Plateau/Dip at 4 Steps:** After the peak at 3 steps, performance slightly declines for "4 steps" across all metrics.
3. **Metric Hierarchy:** The absolute values follow a clear hierarchy: Hits@10 scores are the highest (>0.59), followed by MRR (~0.39-0.45), and then Hits@1 (~0.295-0.35). This is expected, as Hits@10 is a more lenient metric than Hits@1.
4. **Similarity of 1 and 2 Steps:** For MRR and Hits@10, the performance for "1 step" and "2 steps" is nearly identical. For Hits@1, there is a small but visible decrease from 1 to 2 steps.
### Interpretation
The data suggests a non-linear relationship between the number of steps and model performance on these ranking metrics. Performance improves when moving from 1/2 steps to 3 steps, indicating that additional computation or reasoning steps are beneficial up to a point. However, the slight degradation at 4 steps implies potential diminishing returns or the introduction of noise/errors with excessive steps.
The consistent pattern across three different metrics (MRR, Hits@1, Hits@10) strengthens the conclusion that 3 steps is the optimal configuration among those tested for this specific task or model. The chart effectively communicates that more steps are not always better, and there exists a "sweet spot" for performance. This finding would be crucial for optimizing computational efficiency versus accuracy in a production system.