## Bar Chart: Performance Metrics Across Steps
### Overview
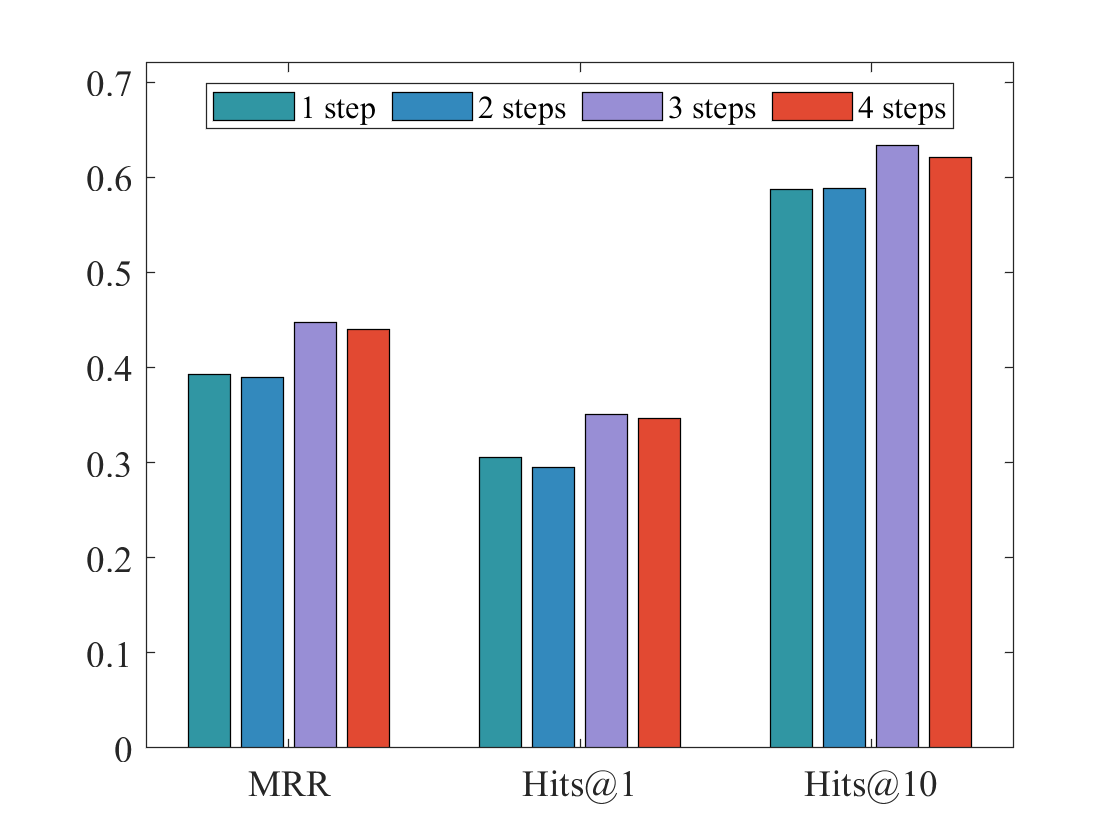
The chart compares performance metrics across four incremental steps (1-4 steps) for three evaluation categories: MRR (Mean Reciprocal Rank), Hits@1, and Hits@10. The y-axis represents normalized performance values (0-0.7), while the x-axis categorizes results by evaluation metric. Each step is color-coded (teal, blue, purple, red) and grouped by category.
### Components/Axes
- **X-axis**: Labeled with three categories:
- MRR (left)
- Hits@1 (center)
- Hits@10 (right)
- **Y-axis**: Scaled from 0 to 0.7 in increments of 0.1.
- **Legend**: Located at the top-right corner, mapping colors to steps:
- Teal: 1 step
- Blue: 2 steps
- Purple: 3 steps
- Red: 4 steps
### Detailed Analysis
1. **MRR Category**:
- 1 step (teal): ~0.40
- 2 steps (blue): ~0.40
- 3 steps (purple): ~0.45
- 4 steps (red): ~0.44
- *Trend*: Gradual increase from 1 to 3 steps, followed by a slight decline at 4 steps.
2. **Hits@1 Category**:
- 1 step (teal): ~0.30
- 2 steps (blue): ~0.30
- 3 steps (purple): ~0.35
- 4 steps (red): ~0.35
- *Trend*: Flat performance at 1-2 steps, then steady improvement to 3-4 steps.
3. **Hits@10 Category**:
- 1 step (teal): ~0.60
- 2 steps (blue): ~0.60
- 3 steps (purple): ~0.65
- 4 steps (red): ~0.63
- *Trend*: Consistent growth until 3 steps, followed by a minor drop at 4 steps.
### Key Observations
- **Performance Correlation**: All categories show improved performance with more steps, though the rate of improvement varies.
- **Anomaly**: Hits@10's 4-step bar (red) dips slightly below the 3-step bar, breaking the upward trend observed in other categories.
- **Color Consistency**: Legend colors match bar colors exactly across all categories.
### Interpretation
The data suggests that incremental steps generally enhance performance, with Hits@10 showing the strongest gains (up to 0.65). The slight decline in Hits@10 at 4 steps may indicate diminishing returns or system-specific constraints. MRR and Hits@1 demonstrate more stable growth patterns, while Hits@10's volatility suggests sensitivity to step increments. This could reflect trade-offs between precision (Hits@1) and recall (Hits@10) in a retrieval system, where additional steps improve coverage but may reduce top-tier accuracy.