## Multi-Panel Scatter Plot: 1D XY mean field
### Overview
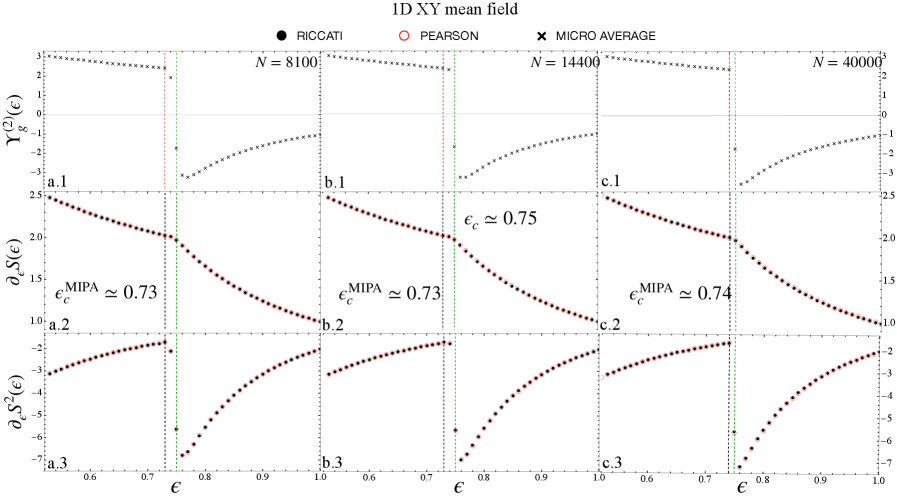
The image presents a 3x3 grid of scatter plots analyzing the behavior of a "1D XY mean field" system. The grid is organized by system size ($N$) in columns and by different mathematical functions in rows. The plots illustrate a phase transition occurring at a critical value of the parameter $\epsilon$ (epsilon), consistently located between 0.7 and 0.8.
### Components/Axes
**Legend (Top Center):**
* **RICCATI**: Represented by black filled circles.
* **PEARSON**: Represented by red open circles.
* **MICRO AVERAGE**: Represented by black 'x' markers.
**Grid Structure:**
* **Columns (System Size $N$):**
* Left Column: $N = 8100$
* Center Column: $N = 14400$
* Right Column: $N = 40000$
* **Rows (Functions):**
* Top Row: $\Upsilon_g^{(2)}(\epsilon)$
* Middle Row: $\partial_\epsilon S(\epsilon)$
* Bottom Row: $\partial_\epsilon S^2(\epsilon)$
**Axes:**
* **X-axis:** $\epsilon$ (epsilon), ranging from approximately 0.6 to 1.0. This axis is shared across all nine plots.
* **Y-axes:**
* Top Row: Range approx. -3 to +3.
* Middle Row: Range approx. 1.0 to 2.5.
* Bottom Row: Range approx. -7 to -2.
**Annotations:**
* Vertical dashed lines (Red and Green) appear in every plot at the critical point $\epsilon_c$.
* Middle Row, Left/Center: $\epsilon_c^{\text{MIPA}} \simeq 0.73$
* Middle Row, Right: $\epsilon_c^{\text{MIPA}} \simeq 0.74$
* Middle Row, Center: $\epsilon_c \simeq 0.75$
### Detailed Analysis
#### Top Row: $\Upsilon_g^{(2)}(\epsilon)$
* **Trend:** The data (using "MICRO AVERAGE" 'x' markers) shows a linear downward slope from $\epsilon \approx 0.6$ to $\approx 0.73$. At the critical point, there is a sharp, discontinuous drop to negative values (approx. -3). Following the discontinuity, the values increase gradually, curving upward toward 0 as $\epsilon$ approaches 1.0.
* **Consistency:** The trend is identical across all three system sizes ($N=8100, 14400, 40000$).
#### Middle Row: $\partial_\epsilon S(\epsilon)$
* **Trend:** The data (using overlapping "RICCATI" black dots and "PEARSON" red circles) shows a linear downward slope from $\epsilon \approx 0.6$ to $\approx 0.73$. At the critical point, there is a sharp discontinuity, followed by a steeper downward slope as $\epsilon$ increases toward 1.0.
* **Consistency:** The overlap between RICCATI and PEARSON data is near-perfect, indicating these two methods yield identical results for this metric.
#### Bottom Row: $\partial_\epsilon S^2(\epsilon)$
* **Trend:** The data (using overlapping "RICCATI" black dots and "PEARSON" red circles) shows a gradual upward slope from $\epsilon \approx 0.6$ to $\approx 0.73$. At the critical point, there is a sharp, discontinuous drop to a minimum value (approx. -7). Following this, the values increase rapidly.
* **Consistency:** Similar to the middle row, the RICCATI and PEARSON data points overlap perfectly.
### Key Observations
* **Method Equivalence:** In the middle and bottom rows, the RICCATI and PEARSON methods produce indistinguishable results, suggesting they are mathematically equivalent or converge to the same solution in this context.
* **Phase Transition:** All three functions exhibit a clear discontinuity at $\epsilon_c \approx 0.73 - 0.75$. This is characteristic of a first-order phase transition.
* **Finite-Size Effects:** While the qualitative behavior is consistent across all $N$, the annotated critical point $\epsilon_c^{\text{MIPA}}$ shifts slightly from 0.73 to 0.74 as the system size $N$ increases from 8100 to 40000.
* **Spatial Grounding:** The legend is positioned at the top center of the entire figure. The labels a.1, a.2, a.3 (left column), b.1, b.2, b.3 (center column), and c.1, c.2, c.3 (right column) serve as identifiers for the sub-plots.
### Interpretation
The data demonstrates a robust phase transition in a 1D XY mean field model. The functions $\Upsilon_g^{(2)}$, $\partial_\epsilon S$, and $\partial_\epsilon S^2$ appear to be thermodynamic derivatives (likely related to entropy $S$). The sharp discontinuities at $\epsilon_c$ indicate that the system undergoes a sudden change in state at this critical parameter value.
The "MIPA" label likely refers to a "Mean Field" approximation method. The fact that the critical point shifts slightly with increasing $N$ suggests that while the transition is present in the mean field limit, finite-size scaling effects are still observable. The perfect overlap between RICCATI and PEARSON data points suggests that for this specific physical model, both analytical approaches are equally valid and provide the same numerical output.