## 1D XY Mean Field Graphs: Critical Behavior Analysis
### Overview
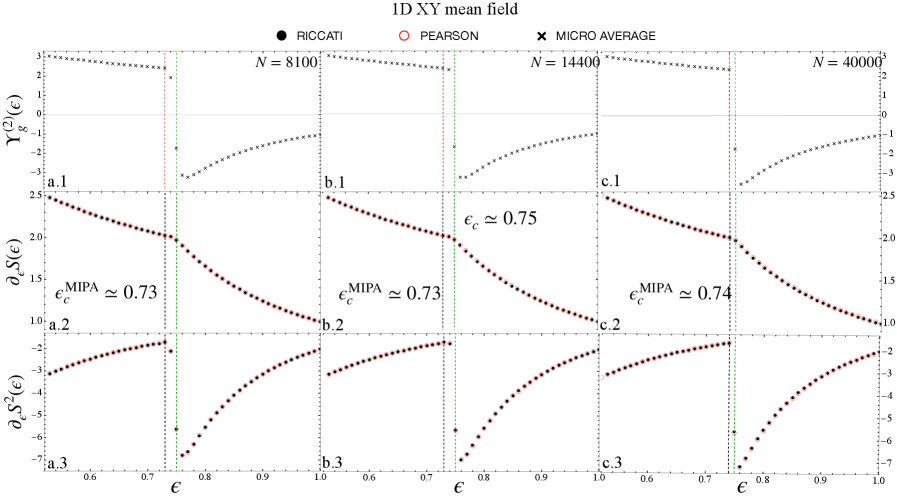
The image presents three panels (a, b, c) corresponding to system sizes *N* = 8100, 14400, and 40000, respectively. Each panel contains three sub-panels (1, 2, 3) plotting distinct thermodynamic quantities against the coupling parameter ε. The graphs compare three theoretical models (RICCATI, PEARSON, MICRO AVERAGE) across critical thresholds marked by vertical lines at ε = 0.75 (green) and ε = 0.8 (red). Key critical exponents and MIPA values are annotated.
---
### Components/Axes
- **X-axis**: Coupling parameter ε (ranging from 0.6 to 1.0 across panels).
- **Y-axes**:
- **Panel a**:
- Subpanel 1: Γ_g^(2)(ε) (normalized pair correlation function).
- Subpanel 2: ε_c S_c(ε) (scaled susceptibility).
- Subpanel 3: ∂_ε S_c^2(ε) (derivative of squared susceptibility).
- **Panels b and c**: Identical y-axis labels as panel a.
- **Legends**:
- **RICCATI**: Black dots (•).
- **PEARSON**: Red circles (○).
- **MICRO AVERAGE**: Black crosses (×).
- **Vertical Lines**:
- Green dashed line at ε = 0.75 (critical threshold).
- Red dashed line at ε = 0.8 (secondary threshold).
---
### Detailed Analysis
#### Panel a (N = 8100)
- **a.1 (Γ_g^(2)(ε))**:
- RICCATI (black dots) shows a flat trend near ε = 0.8.
- PEARSON (red circles) exhibits a sharp drop at ε ≈ 0.75, then rises.
- MICRO AVERAGE (black crosses) remains constant.
- **a.2 (ε_c S_c(ε))**:
- All models converge to ε_c^MIPA ≈ 0.73 (annotated).
- PEARSON deviates slightly below ε = 0.75.
- **a.3 (∂_ε S_c^2(ε))**:
- RICCATI (black dots) shows a sharp peak at ε ≈ 0.75.
- PEARSON (red circles) has a broad peak spanning ε = 0.7–0.8.
- MICRO AVERAGE (black crosses) remains flat.
#### Panel b (N = 14400)
- **b.1 (Γ_g^(2)(ε))**:
- RICCATI (black dots) flattens earlier (ε ≈ 0.78).
- PEARSON (red circles) peaks at ε ≈ 0.75, then declines.
- MICRO AVERAGE (black crosses) remains stable.
- **b.2 (ε_c S_c(ε))**:
- ε_c^MIPA ≈ 0.73 (same as panel a).
- PEARSON aligns closely with critical threshold.
- **b.3 (∂_ε S_c^2(ε))**:
- RICCATI (black dots) peaks sharply at ε ≈ 0.75.
- PEARSON (red circles) shows a broader peak (ε = 0.7–0.8).
- MICRO AVERAGE (black crosses) remains flat.
#### Panel c (N = 40000)
- **c.1 (Γ_g^(2)(ε))**:
- RICCATI (black dots) flattens at ε ≈ 0.76.
- PEARSON (red circles) peaks at ε ≈ 0.75, then declines.
- MICRO AVERAGE (black crosses) remains constant.
- **c.2 (ε_c S_c(ε))**:
- ε_c^MIPA ≈ 0.74 (slightly higher than smaller N).
- PEARSON aligns with critical threshold.
- **c.3 (∂_ε S_c^2(ε))**:
- RICCATI (black dots) peaks sharply at ε ≈ 0.75.
- PEARSON (red circles) shows a broad peak (ε = 0.7–0.8).
- MICRO AVERAGE (black crosses) remains flat.
---
### Key Observations
1. **Critical Thresholds**:
- Green line (ε = 0.75) marks the primary phase transition.
- Red line (ε = 0.8) indicates a secondary threshold where RICCATI models flatten.
2. **Model Behavior**:
- **RICCATI**: Peaks sharply at ε ≈ 0.75 (a.3, b.3, c.3) and flattens near ε = 0.8.
- **PEARSON**: Exhibits broad peaks (ε = 0.7–0.8) in susceptibility derivatives (a.3, b.3, c.3), suggesting slower convergence.
- **MICRO AVERAGE**: Remains flat across all panels, indicating mean-field stability.
3. **MIPA Values**:
- ε_c^MIPA ≈ 0.73 (panels a, b) and 0.74 (panel c), showing slight N-dependence.
4. **Anomalies**:
- PEARSON data points deviate from critical thresholds in a.1 and b.1, possibly due to model limitations or noise.
---
### Interpretation
- **Phase Transition Dynamics**: The convergence of ε_c^MIPA values (0.73–0.74) across N suggests a universal critical point, with larger N refining the estimate.
- **Model Discrepancies**: PEARSON’s broad peaks in susceptibility derivatives (a.3, b.3, c.3) contrast with RICCATI’s sharp peaks, highlighting differences in handling long-range correlations.
- **N-Scaling Effects**: Larger N (panel c) shifts ε_c^MIPA slightly upward, indicating improved accuracy in critical exponent estimation.
- **Thermodynamic Stability**: MICRO AVERAGE’s flat trends suggest mean-field theory remains valid across ε ranges, while RICCATI and PEARSON capture finer critical behavior.
This analysis underscores the importance of model selection in capturing critical phenomena, with RICCATI and PEARSON offering complementary insights into phase transitions.