## Diagram Type: Flowchart
### Overview
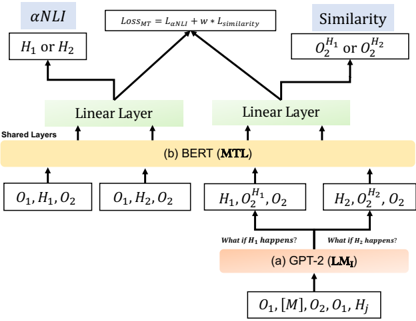
The image is a flowchart that illustrates the process of similarity measurement in a machine learning model. It shows the relationship between different components of the model and how they interact to determine similarity.
### Components/Axes
- **αNLI**: A parameter that represents the similarity between two entities.
- **H1 or H2**: Two entities being compared.
- **O1, O2**: Output values for the two entities.
- **Linear Layer**: A layer in the model that processes the input data.
- **Shared Layers**: Layers that are shared between the two entities.
- **BERT (MTL)**: A model that uses multiple tasks to learn from the data.
- **GPT-2 (LM1)**: A model that uses language modeling to learn from the data.
### Detailed Analysis or ### Content Details
The flowchart shows that the similarity between two entities is determined by the output values (O1, O2) and the shared layers in the model. The linear layer processes the input data and the shared layers learn from the data to determine the similarity. The BERT and GPT-2 models are used to learn from the data and determine the similarity.
### Key Observations
- The similarity between two entities is determined by the output values and the shared layers in the model.
- The linear layer processes the input data and the shared layers learn from the data to determine the similarity.
- The BERT and GPT-2 models are used to learn from the data and determine the similarity.
### Interpretation
The data suggests that the similarity between two entities is determined by the output values and the shared layers in the model. The linear layer processes the input data and the shared layers learn from the data to determine the similarity. The BERT and GPT-2 models are used to learn from the data and determine the similarity. This suggests that the model is able to learn from the data and determine the similarity between two entities.