## Diagram: Hexagonal Symbol Arrangement
### Overview
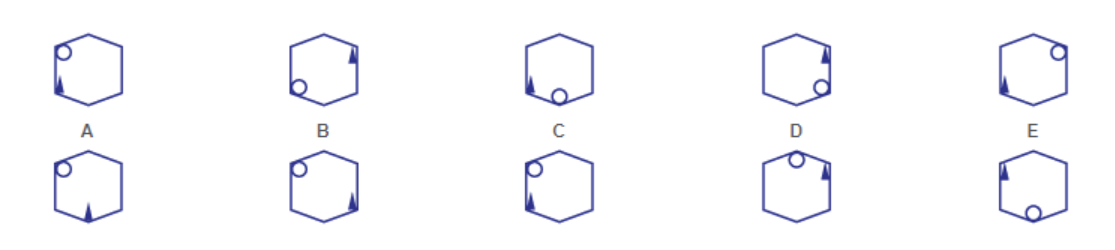
The image displays five hexagonal shapes labeled **A, B, C, D, E**, arranged in two rows (top and bottom). Each hexagon contains a **circle** and an **arrow**, positioned in specific corners. No numerical data, axes, or legends are present.
### Components/Axes
- **Labels**: A, B, C, D, E (textual identifiers).
- **Symbols**:
- **Circle**: Appears in one corner of each hexagon.
- **Arrow**: Appears in another corner of each hexagon.
- **Positioning**:
- **Top Row**: A (circle top-left, arrow bottom-left), B (circle bottom-left, arrow top-right), C (circle bottom-left, arrow bottom-right), D (circle top-right, arrow bottom-right), E (circle top-right, arrow bottom-left).
- **Bottom Row**: A (circle top-left, arrow bottom-left), B (circle bottom-left, arrow top-right), C (circle bottom-left, arrow bottom-right), D (circle top-right, arrow bottom-right), E (circle top-right, arrow bottom-left).
### Detailed Analysis
- **Hexagon A**: Circle in top-left corner, arrow in bottom-left corner.
- **Hexagon B**: Circle in bottom-left corner, arrow in top-right corner.
- **Hexagon C**: Circle in bottom-left corner, arrow in bottom-right corner.
- **Hexagon D**: Circle in top-right corner, arrow in bottom-right corner.
- **Hexagon E**: Circle in top-right corner, arrow in bottom-left corner.
### Key Observations
- No numerical values, scales, or legends are present.
- The arrangement of symbols (circle and arrow) varies systematically across the hexagons.
- The labels (A–E) are positioned below each hexagon.
### Interpretation
The diagram likely represents a **process flow** or **state transitions**, where each hexagon corresponds to a step or condition. The **circle** and **arrow** may symbolize:
- **Circle**: A state, node, or reference point.
- **Arrow**: Direction of movement, transition, or action.
The systematic variation in symbol placement suggests a **logical sequence** or **decision tree**, though no explicit rules or data are provided. The absence of numerical data limits quantitative analysis, but the visual pattern implies a structured relationship between the hexagons.