## Bar Chart: Model Performance Across Benchmarks
### Overview
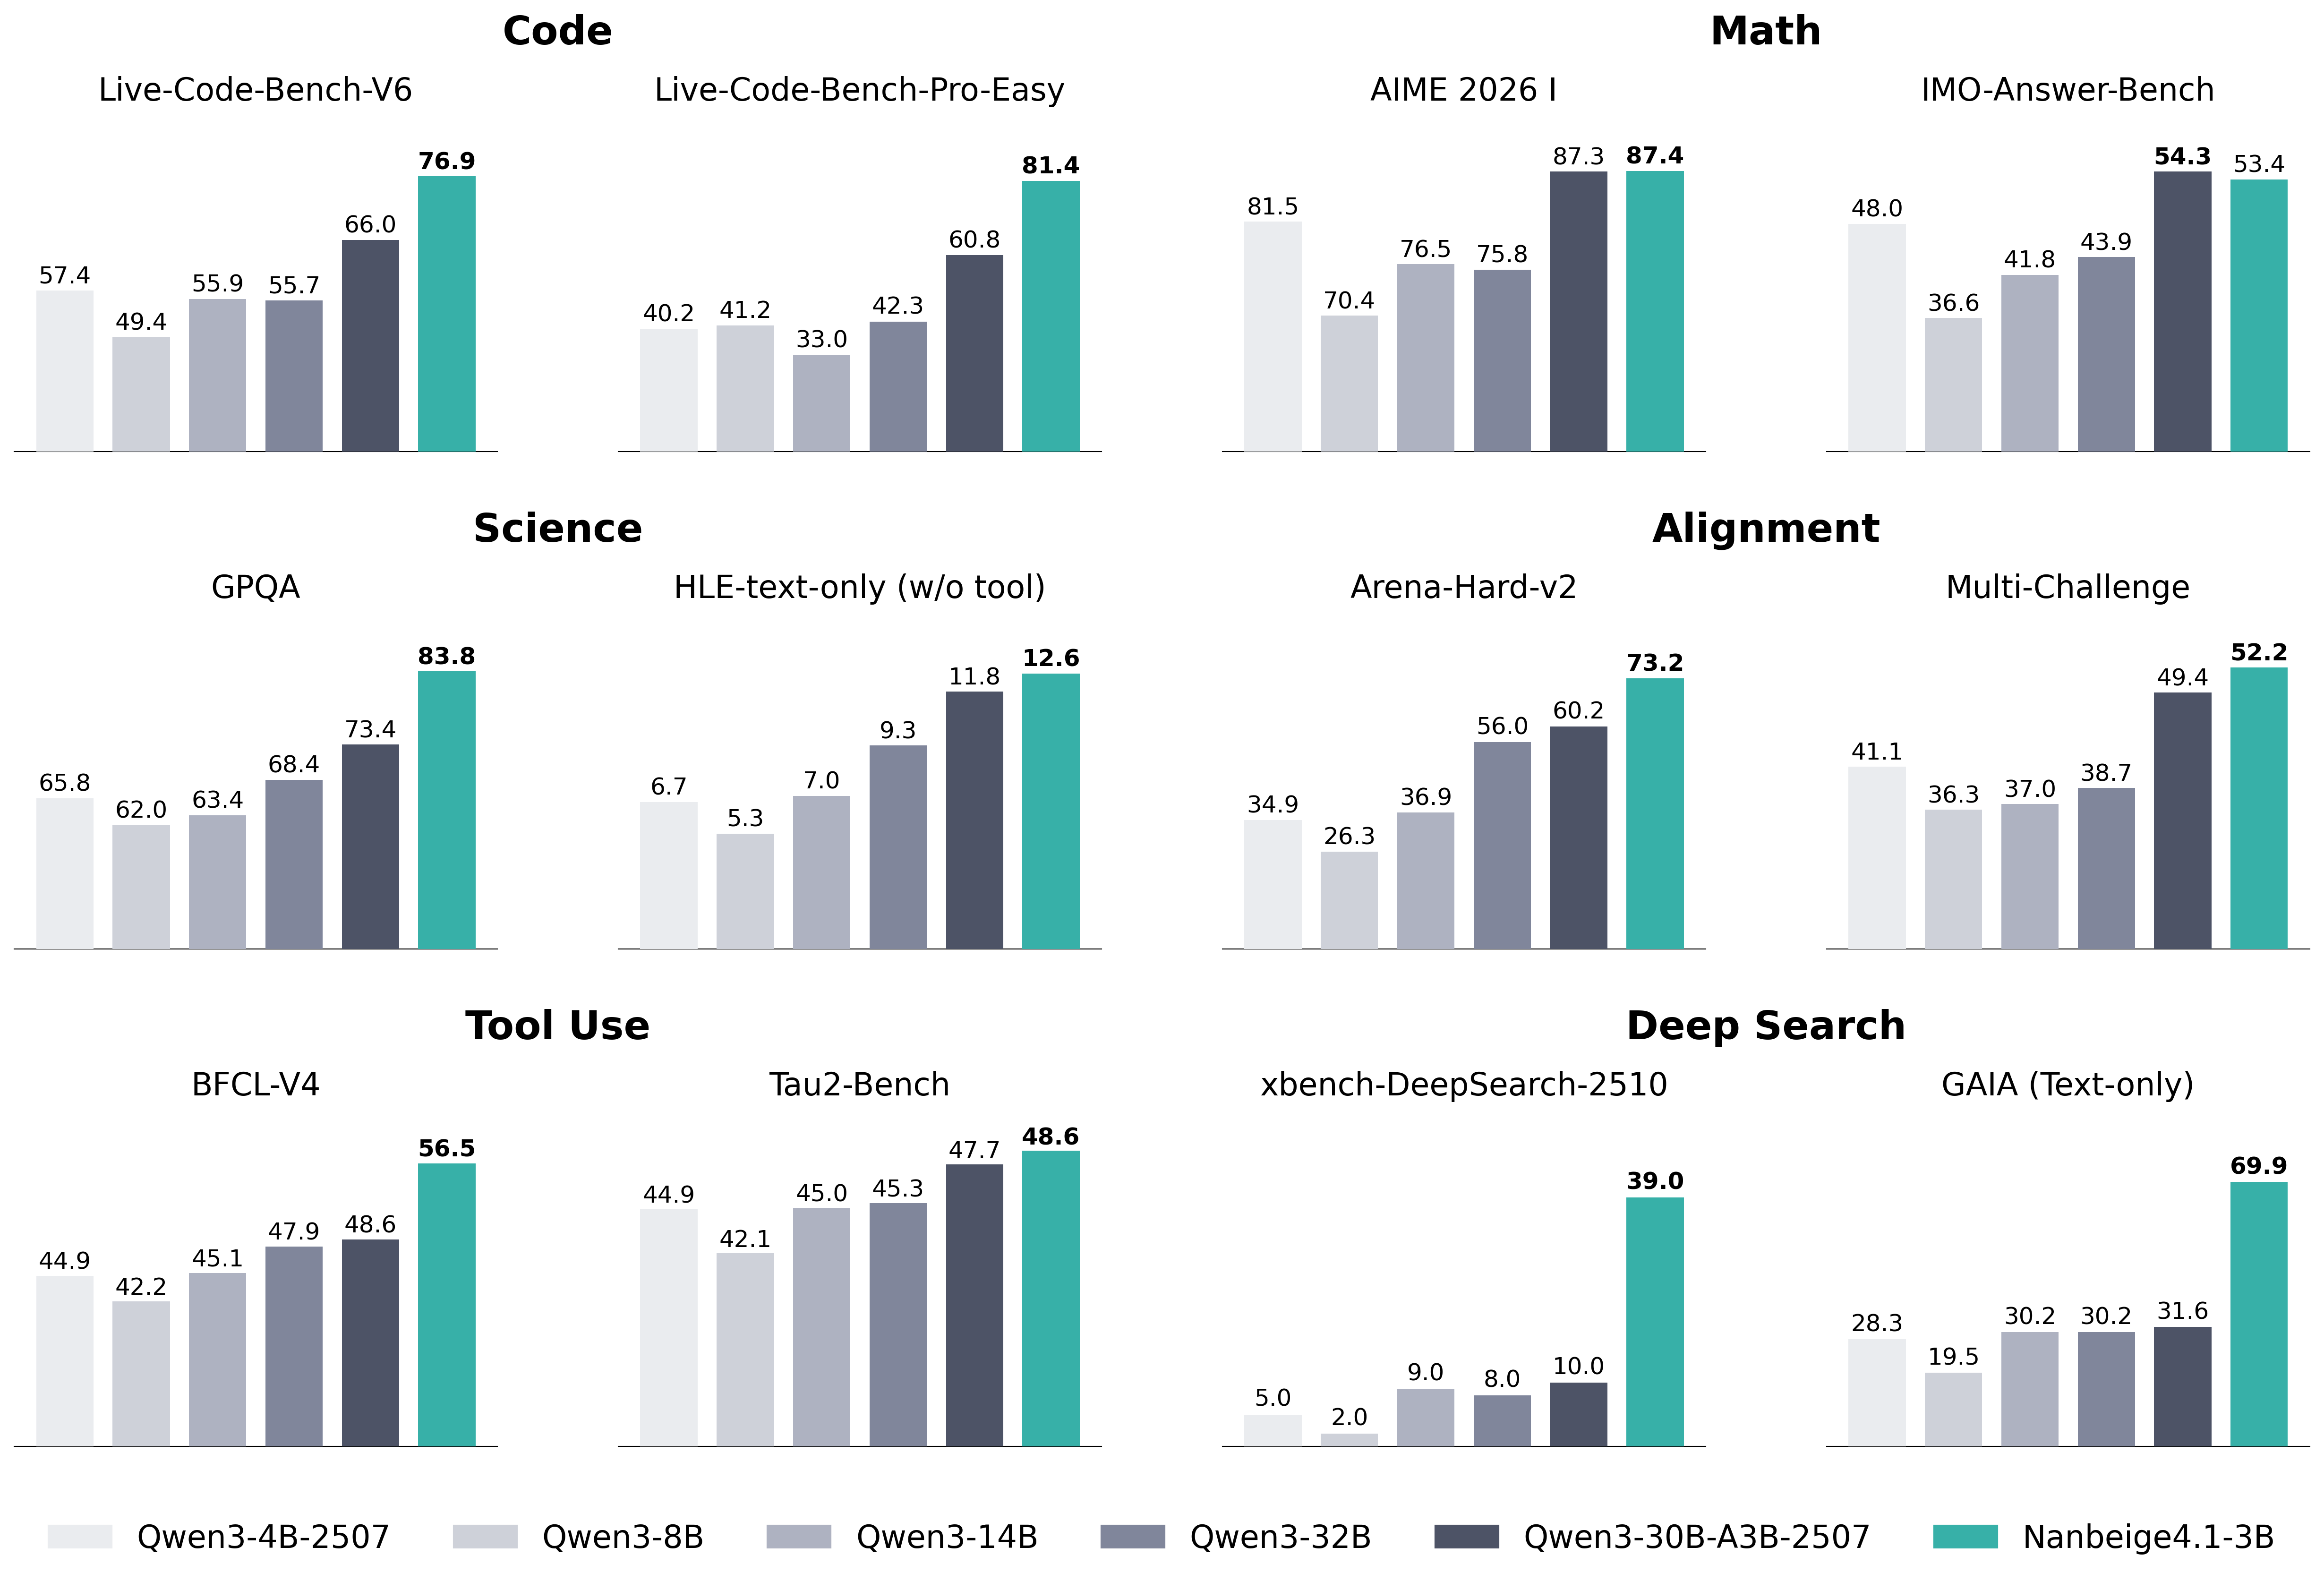
The image presents a bar chart comparing the performance of several language models (Qwen3-4B-2507, Qwen3-8B, Qwen3-14B, Qwen3-32B, Qwen3-30B-A3B-2507, and Nanbeige4.1-3B) across a variety of benchmarks. The benchmarks are categorized into Code, Science, Alignment, Tool Use, and Deep Search. Performance is measured as a percentage score.
### Components/Axes
* **X-axis:** Represents the different benchmarks. The benchmarks are: Live-Code-Bench-V6, Live-Code-Bench-Pro-Easy, AIME 2026 I, IMO-Answer-Bench, GPQA, HLE-text-only (w/o tool), Arena-Hard-v2, Multi-Challenge, BFCL-V4, Tau2-Bench, xbench-DeepSearch-2510, and GAIA (Text-only).
* **Y-axis:** Represents the performance score, ranging from approximately 0% to 90%. No explicit scale is provided, but values are displayed on the bars.
* **Legend (Bottom-Center):** Identifies the different models using color-coding:
* Qwen3-4B-2507 (Lightest Gray)
* Qwen3-8B (Gray)
* Qwen3-14B (Darker Gray)
* Qwen3-32B (Blue)
* Qwen3-30B-A3B-2507 (Green)
* Nanbeige4.1-3B (Orange)
### Detailed Analysis
**Code:**
* **Live-Code-Bench-V6:** Qwen3-4B-2507: 57.4, Qwen3-8B: 55.9, Qwen3-14B: 55.7, Qwen3-32B: 66.0, Qwen3-30B-A3B-2507: 76.9, Nanbeige4.1-3B: N/A
* **Live-Code-Bench-Pro-Easy:** Qwen3-4B-2507: 40.2, Qwen3-8B: 41.2, Qwen3-14B: 42.3, Qwen3-32B: 60.8, Qwen3-30B-A3B-2507: 81.4, Nanbeige4.1-3B: 33.0
* **AIME 2026 I:** Qwen3-4B-2507: 70.4, Qwen3-8B: 75.8, Qwen3-14B: 76.5, Qwen3-32B: 81.5, Qwen3-30B-A3B-2507: 87.3, Nanbeige4.1-3B: 87.4
* **IMO-Answer-Bench:** Qwen3-4B-2507: 36.6, Qwen3-8B: 41.8, Qwen3-14B: 43.9, Qwen3-32B: 48.0, Qwen3-30B-A3B-2507: 54.3, Nanbeige4.1-3B: 53.4
**Science:**
* **GPQA:** Qwen3-4B-2507: 65.8, Qwen3-8B: 62.0, Qwen3-14B: 63.4, Qwen3-32B: 68.4, Qwen3-30B-A3B-2507: 83.8, Nanbeige4.1-3B: 73.4
* **HLE-text-only (w/o tool):** Qwen3-4B-2507: 5.3, Qwen3-8B: 6.7, Qwen3-14B: 7.0, Qwen3-32B: 9.3, Qwen3-30B-A3B-2507: 11.8, Nanbeige4.1-3B: 12.6
**Alignment:**
* **Arena-Hard-v2:** Qwen3-4B-2507: 26.3, Qwen3-8B: 34.9, Qwen3-14B: 36.9, Qwen3-32B: 56.0, Qwen3-30B-A3B-2507: 73.2, Nanbeige4.1-3B: 41.1
* **Multi-Challenge:** Qwen3-4B-2507: 36.7, Qwen3-8B: 37.0, Qwen3-14B: 38.7, Qwen3-32B: 49.4, Qwen3-30B-A3B-2507: 52.2, Nanbeige4.1-3B: 36.3
**Tool Use:**
* **BFCL-V4:** Qwen3-4B-2507: 44.9, Qwen3-8B: 42.2, Qwen3-14B: 47.9, Qwen3-32B: 48.6, Qwen3-30B-A3B-2507: 56.5, Nanbeige4.1-3B: 46.1
* **Tau2-Bench:** Qwen3-4B-2507: 44.9, Qwen3-8B: 42.1, Qwen3-14B: 45.0, Qwen3-32B: 45.3, Qwen3-30B-A3B-2507: 47.7, Nanbeige4.1-3B: 48.6
**Deep Search:**
* **xbench-DeepSearch-2510:** Qwen3-4B-2507: 2.0, Qwen3-8B: 8.0, Qwen3-14B: 9.0, Qwen3-32B: 10.0, Qwen3-30B-A3B-2507: 39.0, Nanbeige4.1-3B: 5.0
* **GAIA (Text-only):** Qwen3-4B-2507: 19.5, Qwen3-8B: 30.2, Qwen3-14B: 30.2, Qwen3-32B: 31.6, Qwen3-30B-A3B-2507: 69.9, Nanbeige4.1-3B: 28.3
### Key Observations
* Qwen3-30B-A3B-2507 consistently outperforms other models across most benchmarks, often by a significant margin.
* Nanbeige4.1-3B shows competitive performance in some areas (e.g., IMO-Answer-Bench), but generally lags behind Qwen3-30B-A3B-2507.
* Performance generally increases with model size (Qwen3-4B < Qwen3-8B < Qwen3-14B < Qwen3-32B), but the jump from Qwen3-32B to Qwen3-30B-A3B-2507 is substantial.
* HLE-text-only (w/o tool) consistently yields low scores for all models.
### Interpretation
The data suggests that Qwen3-30B-A3B-2507 is the most capable model across the evaluated benchmarks. The consistent outperformance indicates that the architectural or training modifications in this model are highly effective. The large performance gap between Qwen3-32B and Qwen3-30B-A3B-2507 suggests that the specific improvements in the latter model are more impactful than simply increasing model size. The low scores on HLE-text-only (w/o tool) indicate that this benchmark is particularly challenging, or that the models rely heavily on external tools for this task. The varying performance across different benchmarks highlights the importance of evaluating models on a diverse set of tasks to obtain a comprehensive understanding of their capabilities. The data also suggests that model size is a significant factor in performance, but not the only one.