## Bar Chart: Performance Comparison of ROAR Variants
### Overview
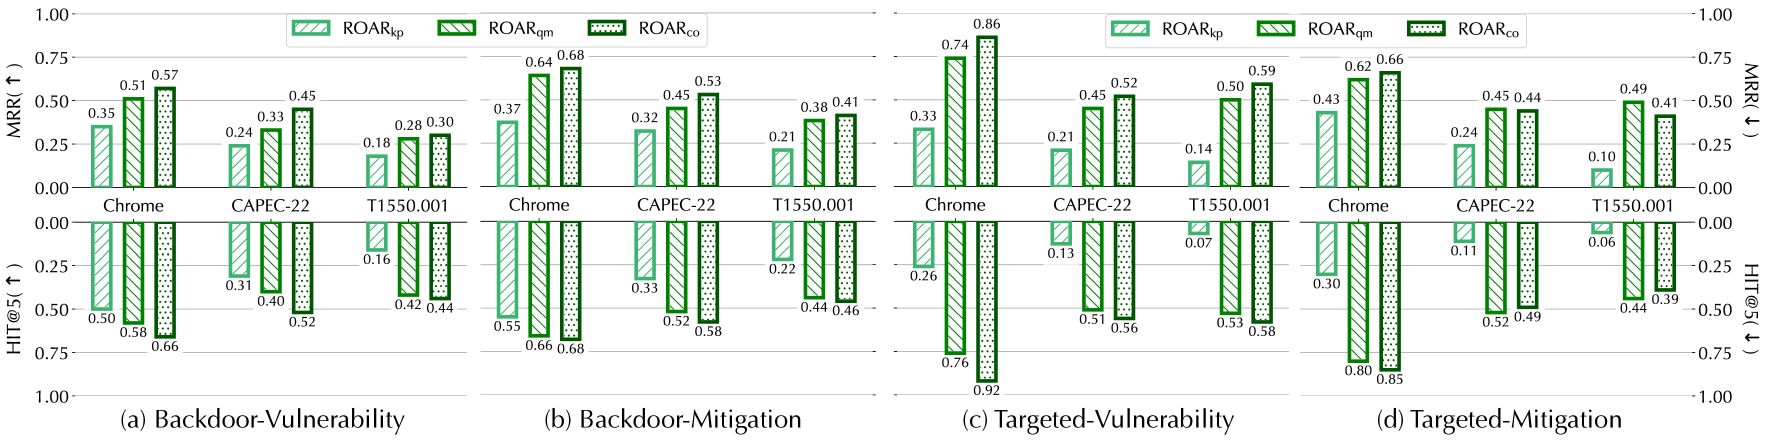
The image presents a composite of four grouped bar charts, labeled (a) through (d), comparing the performance of three variants of a method called "ROAR" (`ROAR_kp`, `ROAR_qm`, `ROAR_co`) across three datasets (Chrome, CAPEC-22, T1550.001). The charts are categorized by task type: Backdoor (Vulnerability/Mitigation) and Targeted (Vulnerability/Mitigation). The metrics used are MRR (Mean Reciprocal Rank) and HIT@5.
### Components/Axes
* **Legend:** Located at the top of the chart (repeated for the left and right halves).
* `ROAR_kp`: Light green, diagonal stripes.
* `ROAR_qm`: Medium green, diagonal stripes.
* `ROAR_co`: Dark green, dotted pattern.
* **X-Axis:** Categorical datasets: Chrome, CAPEC-22, T1550.001.
* **Y-Axis (Top):** MRR (Mean Reciprocal Rank).
* **Y-Axis (Bottom):** HIT@5.
* **Sub-charts:**
* (a) Backdoor-Vulnerability
* (b) Backdoor-Mitigation
* (c) Targeted-Vulnerability
* (d) Targeted-Mitigation
### Detailed Analysis
#### (a) Backdoor-Vulnerability
| Metric | Dataset | ROAR_kp | ROAR_qm | ROAR_co |
| :--- | :--- | :--- | :--- | :--- |
| **MRR** | Chrome | 0.35 | 0.51 | 0.57 |
| | CAPEC-22 | 0.24 | 0.33 | 0.45 |
| | T1550.001 | 0.18 | 0.28 | 0.30 |
| **HIT@5** | Chrome | 0.50 | 0.58 | 0.66 |
| | CAPEC-22 | 0.31 | 0.40 | 0.52 |
| | T1550.001 | 0.16 | 0.42 | 0.44 |
#### (b) Backdoor-Mitigation
| Metric | Dataset | ROAR_kp | ROAR_qm | ROAR_co |
| :--- | :--- | :--- | :--- | :--- |
| **MRR** | Chrome | 0.37 | 0.64 | 0.68 |
| | CAPEC-22 | 0.32 | 0.45 | 0.53 |
| | T1550.001 | 0.21 | 0.38 | 0.41 |
| **HIT@5** | Chrome | 0.55 | 0.66 | 0.68 |
| | CAPEC-22 | 0.22 | 0.52 | 0.58 |
| | T1550.001 | 0.22 | 0.44 | 0.46 |
#### (c) Targeted-Vulnerability
| Metric | Dataset | ROAR_kp | ROAR_qm | ROAR_co |
| :--- | :--- | :--- | :--- | :--- |
| **MRR** | Chrome | 0.33 | 0.74 | 0.86 |
| | CAPEC-22 | 0.21 | 0.45 | 0.52 |
| | T1550.001 | 0.14 | 0.50 | 0.59 |
| **HIT@5** | Chrome | 0.26 | 0.76 | 0.92 |
| | CAPEC-22 | 0.13 | 0.51 | 0.56 |
| | T1550.001 | 0.07 | 0.53 | 0.58 |
#### (d) Targeted-Mitigation
| Metric | Dataset | ROAR_kp | ROAR_qm | ROAR_co |
| :--- | :--- | :--- | :--- | :--- |
| **MRR** | Chrome | 0.43 | 0.62 | 0.66 |
| | CAPEC-22 | 0.24 | 0.45 | 0.44 |
| | T1550.001 | 0.10 | 0.49 | 0.41 |
| **HIT@5** | Chrome | 0.30 | 0.80 | 0.85 |
| | CAPEC-22 | 0.11 | 0.52 | 0.49 |
| | T1550.001 | 0.06 | 0.44 | 0.39 |
### Key Observations
* **Performance Hierarchy:** Across almost all datasets and tasks, `ROAR_co` (dotted) consistently achieves the highest performance, followed by `ROAR_qm`, with `ROAR_kp` (lightest) consistently performing the worst.
* **Dataset Difficulty:** Performance generally trends downward from Chrome to CAPEC-22 to T1550.001, suggesting that the Chrome dataset is the least challenging or most compatible with these methods.
* **Targeted vs. Backdoor:** The Targeted scenarios (c and d) exhibit a wider performance gap between the methods compared to the Backdoor scenarios (a and b), particularly in the Chrome dataset where `ROAR_co` reaches a high of 0.92 in HIT@5.
* **Anomalies:** In (d) Targeted-Mitigation, `ROAR_co` performs slightly worse than `ROAR_qm` for the CAPEC-22 and T1550.001 datasets, breaking the general trend where `ROAR_co` is the top performer.
### Interpretation
The data demonstrates a clear hierarchy of effectiveness among the ROAR variants, with `ROAR_co` being the most robust and effective method. The consistent performance gap between `ROAR_kp` and the other two variants suggests that the modifications introduced in `ROAR_qm` and `ROAR_co` provide substantial improvements in both vulnerability detection and mitigation tasks. The performance degradation across datasets indicates that these models are highly sensitive to the underlying data distribution, with the "Chrome" dataset being significantly more amenable to these methods than the others. The anomaly in the Targeted-Mitigation chart suggests that while `ROAR_co` is generally superior, its advantage is not universal and may be task-dependent.