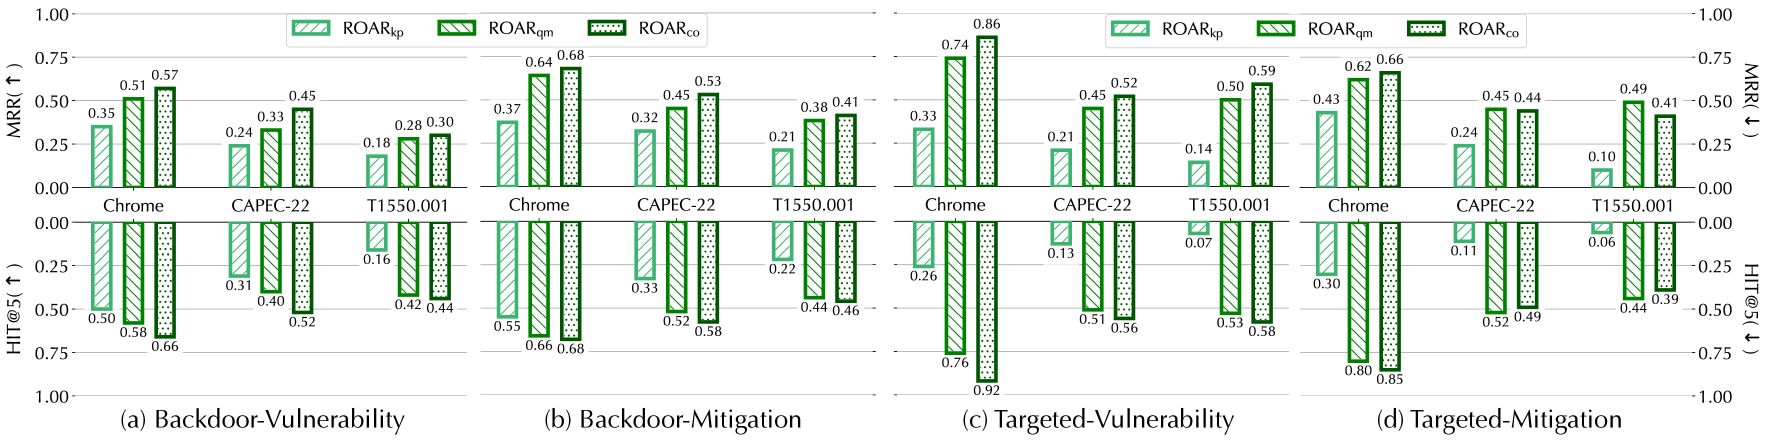
## Grouped Bar Chart: MRR and HIT@5 for Backdoor/Targeted Vulnerability/Mitigation
### Overview
The image is a grouped bar chart with two subplots (top: **MRR** (Mean Reciprocal Rank), bottom: **HIT@5** (Hit Rate at 5)) across four scenarios:
- (a) Backdoor-Vulnerability
- (b) Backdoor-Mitigation
- (c) Targeted-Vulnerability
- (d) Targeted-Mitigation
Each scenario compares three methods (ROARₖₚ, ROARₙₘ, ROARₙₒ) across three categories: *Chrome*, *CAPEC-22*, and *T1550.001*.
### Components/Axes
- **Y-Axes**:
- Top (MRR): Range `0.00–1.00` (higher values = better MRR).
- Bottom (HIT@5): Range `0.00–1.00` (inverted: lower on the axis = higher HIT@5).
- **X-Axis Categories**: *Chrome*, *CAPEC-22*, *T1550.001* (repeated for each scenario).
- **Legend**:
- ROARₖₚ: Light green, diagonal stripes.
- ROARₙₘ: Medium green, solid.
- ROARₙₒ: Dark green, dotted.
- **Scenarios**: Labeled below each subplot (a–d).
### Detailed Analysis (Subplot by Subplot)
#### (a) Backdoor-Vulnerability
- **MRR (Top)**:
- *Chrome*: ROARₖₚ=0.35, ROARₙₘ=0.51, ROARₙₒ=0.57 (increasing trend: kp < qm < co).
- *CAPEC-22*: ROARₖₚ=0.24, ROARₙₘ=0.33, ROARₙₒ=0.45 (increasing trend).
- *T1550.001*: ROARₖₚ=0.18, ROARₙₘ=0.28, ROARₙₒ=0.30 (increasing trend).
- **HIT@5 (Bottom)**:
- *Chrome*: ROARₖₚ=0.50, ROARₙₘ=0.58, ROARₙₒ=0.66 (increasing trend: kp < qm < co).
- *CAPEC-22*: ROARₖₚ=0.31, ROARₙₘ=0.40, ROARₙₒ=0.52 (increasing trend).
- *T1550.001*: ROARₖₚ=0.16, ROARₙₘ=0.42, ROARₙₒ=0.44 (increasing trend).
#### (b) Backdoor-Mitigation
- **MRR (Top)**:
- *Chrome*: ROARₖₚ=0.37, ROARₙₘ=0.64, ROARₙₒ=0.68 (increasing trend).
- *CAPEC-22*: ROARₖₚ=0.32, ROARₙₘ=0.45, ROARₙₒ=0.53 (increasing trend).
- *T1550.001*: ROARₖₚ=0.21, ROARₙₘ=0.38, ROARₙₒ=0.41 (increasing trend).
- **HIT@5 (Bottom)**:
- *Chrome*: ROARₖₚ=0.55, ROARₙₘ=0.66, ROARₙₒ=0.68 (increasing trend).
- *CAPEC-22*: ROARₖₚ=0.33, ROARₙₘ=0.52, ROARₙₒ=0.58 (increasing trend).
- *T1550.001*: ROARₖₚ=0.22, ROARₙₘ=0.44, ROARₙₒ=0.46 (increasing trend).
#### (c) Targeted-Vulnerability
- **MRR (Top)**:
- *Chrome*: ROARₖₚ=0.33, ROARₙₘ=0.74, ROARₙₒ=0.86 (large jump for qm/co).
- *CAPEC-22*: ROARₖₚ=0.21, ROARₙₘ=0.45, ROARₙₒ=0.52 (increasing trend).
- *T1550.001*: ROARₖₚ=0.14, ROARₙₘ=0.50, ROARₙₒ=0.59 (large jump for qm/co).
- **HIT@5 (Bottom)**:
- *Chrome*: ROARₖₚ=0.26, ROARₙₘ=0.76, ROARₙₒ=0.92 (large jump for qm/co).
- *CAPEC-22*: ROARₖₚ=0.13, ROARₙₘ=0.51, ROARₙₒ=0.56 (increasing trend).
- *T1550.001*: ROARₖₚ=0.07, ROARₙₘ=0.53, ROARₙₒ=0.58 (large jump for qm/co).
#### (d) Targeted-Mitigation
- **MRR (Top)**:
- *Chrome*: ROARₖₚ=0.43, ROARₙₘ=0.62, ROARₙₒ=0.66 (increasing trend).
- *CAPEC-22*: ROARₖₚ=0.24, ROARₙₘ=0.45, ROARₙₒ=0.44 (slight decrease for co).
- *T1550.001*: ROARₖₚ=0.10, ROARₙₘ=0.49, ROARₙₒ=0.41 (decrease for co).
- **HIT@5 (Bottom)**:
- *Chrome*: ROARₖₚ=0.30, ROARₙₘ=0.80, ROARₙₒ=0.85 (increasing trend).
- *CAPEC-22*: ROARₖₚ=0.11, ROARₙₘ=0.52, ROARₙₒ=0.49 (slight decrease for co).
- *T1550.001*: ROARₖₚ=0.06, ROARₙₘ=0.44, ROARₙₒ=0.39 (decrease for co).
### Key Observations
- **Method Hierarchy**: ROARₙₒ consistently outperforms ROARₙₘ, which outperforms ROARₖₚ (increasing trend across methods).
- **Scenario Sensitivity**: Targeted scenarios (c, d) show larger performance gaps between methods (e.g., *Chrome* in (c) MRR: 0.33 vs 0.86) than Backdoor scenarios (a, b).
- **Category Differences**: *Chrome* often has higher MRR/HIT@5 than *CAPEC-22* and *T1550.001*, especially in Targeted scenarios.
- **Anomalies**: In (d) Targeted-Mitigation, *CAPEC-22* and *T1550.001* show a slight decrease in ROARₙₒ performance (deviating from the usual increasing trend).
### Interpretation
The chart evaluates three methods for vulnerability detection/mitigation (Backdoor vs Targeted) across three categories. ROARₙₒ’s consistent superiority suggests it is more effective for these tasks. Targeted scenarios amplify performance differences, indicating the methods are more sensitive to targeted attacks. *Chrome*’s higher performance may reflect its relevance or complexity in the dataset. The anomalies in (d) suggest ROARₙₒ’s effectiveness varies by category in targeted mitigation, warranting further investigation.
(Note: All values are approximate, based on visual extraction from the chart.)