## Line Charts: Best-of-N Performance on GPQA-physics and LiveCodeBench (OOD)
### Overview
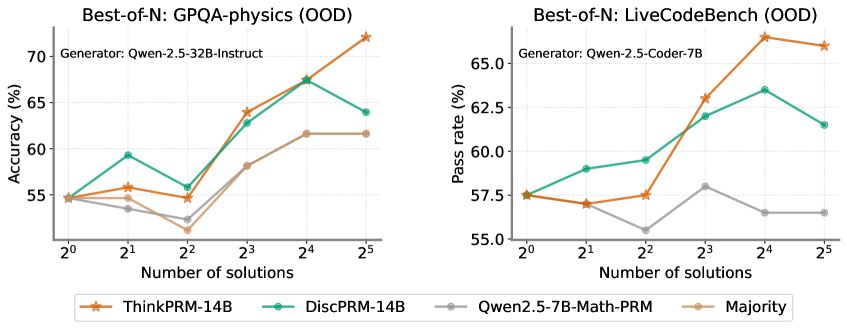
The image presents two line charts comparing the performance of different models on the GPQA-physics and LiveCodeBench datasets, both evaluated in an Out-of-Distribution (OOD) setting. The charts show how accuracy (for GPQA-physics) and pass rate (for LiveCodeBench) change with an increasing number of solutions considered ("Best-of-N"). The models compared are ThinkPRM-14B, DiscPRM-14B, Qwen2.5-7B-Math-PRM, and a "Majority" baseline.
### Components/Axes
**Left Chart (GPQA-physics):**
* **Title:** Best-of-N: GPQA-physics (OOD)
* **Generator:** Qwen-2.5-32B-Instruct
* **Y-axis:** Accuracy (%) - Scale ranges from 55 to 70.
* **X-axis:** Number of solutions - Logarithmic scale with values 2<sup>0</sup>, 2<sup>1</sup>, 2<sup>2</sup>, 2<sup>3</sup>, 2<sup>4</sup>, 2<sup>5</sup>.
* **Legend:** Located at the bottom of the chart.
* ThinkPRM-14B (Brown-Orange with star marker)
* DiscPRM-14B (Teal with circle marker)
* Qwen2.5-7B-Math-PRM (Gray with circle marker)
* Majority (Tan with no marker)
**Right Chart (LiveCodeBench):**
* **Title:** Best-of-N: LiveCodeBench (OOD)
* **Generator:** Qwen-2.5-Coder-7B
* **Y-axis:** Pass rate (%) - Scale ranges from 55.0 to 65.0.
* **X-axis:** Number of solutions - Logarithmic scale with values 2<sup>0</sup>, 2<sup>1</sup>, 2<sup>2</sup>, 2<sup>3</sup>, 2<sup>4</sup>, 2<sup>5</sup>.
* **Legend:** Located at the bottom of the left chart, shared between both charts.
* ThinkPRM-14B (Brown-Orange with star marker)
* DiscPRM-14B (Teal with circle marker)
* Qwen2.5-7B-Math-PRM (Gray with circle marker)
* Majority (Tan with no marker)
### Detailed Analysis
**Left Chart (GPQA-physics):**
* **ThinkPRM-14B (Brown-Orange):** Starts at approximately 55% accuracy at 2<sup>0</sup> solutions, shows a generally upward trend, reaching approximately 72% at 2<sup>5</sup> solutions.
* (2<sup>0</sup>, 55%), (2<sup>1</sup>, 56%), (2<sup>2</sup>, 55%), (2<sup>3</sup>, 64%), (2<sup>4</sup>, 67%), (2<sup>5</sup>, 72%)
* **DiscPRM-14B (Teal):** Starts at approximately 55% accuracy at 2<sup>0</sup> solutions, increases to approximately 59% at 2<sup>1</sup> solutions, dips to approximately 56% at 2<sup>2</sup> solutions, then increases to approximately 67% at 2<sup>4</sup> solutions, and decreases to approximately 64% at 2<sup>5</sup> solutions.
* (2<sup>0</sup>, 55%), (2<sup>1</sup>, 59%), (2<sup>2</sup>, 56%), (2<sup>3</sup>, 64%), (2<sup>4</sup>, 67%), (2<sup>5</sup>, 64%)
* **Qwen2.5-7B-Math-PRM (Gray):** Starts at approximately 55% accuracy at 2<sup>0</sup> solutions, decreases to approximately 53% at 2<sup>1</sup> solutions, decreases to approximately 52% at 2<sup>2</sup> solutions, then increases to approximately 58% at 2<sup>3</sup> solutions, and plateaus at approximately 62% at 2<sup>4</sup> and 2<sup>5</sup> solutions.
* (2<sup>0</sup>, 55%), (2<sup>1</sup>, 53%), (2<sup>2</sup>, 52%), (2<sup>3</sup>, 58%), (2<sup>4</sup>, 62%), (2<sup>5</sup>, 62%)
* **Majority (Tan):** Starts at approximately 55% accuracy at 2<sup>0</sup> solutions, increases to approximately 56% at 2<sup>1</sup> solutions, decreases to approximately 52% at 2<sup>2</sup> solutions, then increases to approximately 62% at 2<sup>3</sup> solutions, and plateaus at approximately 62% at 2<sup>4</sup> and 2<sup>5</sup> solutions.
* (2<sup>0</sup>, 55%), (2<sup>1</sup>, 56%), (2<sup>2</sup>, 52%), (2<sup>3</sup>, 62%), (2<sup>4</sup>, 62%), (2<sup>5</sup>, 62%)
**Right Chart (LiveCodeBench):**
* **ThinkPRM-14B (Brown-Orange):** Starts at approximately 57.5% pass rate at 2<sup>0</sup> solutions, shows a generally upward trend, reaching approximately 67% at 2<sup>4</sup> solutions, and decreases to approximately 66.5% at 2<sup>5</sup> solutions.
* (2<sup>0</sup>, 57.5%), (2<sup>1</sup>, 57%), (2<sup>2</sup>, 57%), (2<sup>3</sup>, 61%), (2<sup>4</sup>, 67%), (2<sup>5</sup>, 66.5%)
* **DiscPRM-14B (Teal):** Starts at approximately 58% pass rate at 2<sup>0</sup> solutions, increases to approximately 59% at 2<sup>1</sup> solutions, increases to approximately 60% at 2<sup>2</sup> solutions, then increases to approximately 63% at 2<sup>3</sup> solutions, and decreases to approximately 61% at 2<sup>5</sup> solutions.
* (2<sup>0</sup>, 58%), (2<sup>1</sup>, 59%), (2<sup>2</sup>, 60%), (2<sup>3</sup>, 63%), (2<sup>4</sup>, 63.5%), (2<sup>5</sup>, 61%)
* **Qwen2.5-7B-Math-PRM (Gray):** Starts at approximately 57.5% pass rate at 2<sup>0</sup> solutions, decreases to approximately 57% at 2<sup>1</sup> solutions, decreases to approximately 56% at 2<sup>2</sup> solutions, then increases to approximately 59% at 2<sup>3</sup> solutions, and plateaus at approximately 56% at 2<sup>4</sup> and 2<sup>5</sup> solutions.
* (2<sup>0</sup>, 57.5%), (2<sup>1</sup>, 57%), (2<sup>2</sup>, 56%), (2<sup>3</sup>, 59%), (2<sup>4</sup>, 56%), (2<sup>5</sup>, 56%)
* **Majority (Tan):** The "Majority" baseline is not present in the LiveCodeBench chart.
### Key Observations
* **GPQA-physics:** ThinkPRM-14B consistently outperforms the other models as the number of solutions increases. The Qwen2.5-7B-Math-PRM and Majority models show similar performance, plateauing after 2<sup>3</sup> solutions.
* **LiveCodeBench:** ThinkPRM-14B shows the highest pass rate, especially at higher numbers of solutions. DiscPRM-14B initially performs well but plateaus and decreases slightly at 2<sup>5</sup> solutions. Qwen2.5-7B-Math-PRM shows the lowest performance.
* **OOD Setting:** Both datasets are evaluated in an Out-of-Distribution setting, which likely explains the relatively lower performance compared to in-distribution benchmarks.
### Interpretation
The charts demonstrate the impact of "Best-of-N" sampling on the performance of different language models on two distinct tasks: physics problem-solving (GPQA-physics) and code generation (LiveCodeBench). The results suggest that increasing the number of solutions considered can significantly improve performance, particularly for the ThinkPRM-14B model. The OOD setting highlights the models' ability to generalize to unseen data distributions. The performance differences between the models likely reflect their architectural strengths and weaknesses, as well as their training data. The "Majority" baseline in GPQA-physics provides a reference point for understanding the added value of the other models. The absence of the "Majority" baseline in the LiveCodeBench chart suggests it was not applicable or relevant for that task.