## Charts: Best-of-N Performance Comparison
### Overview
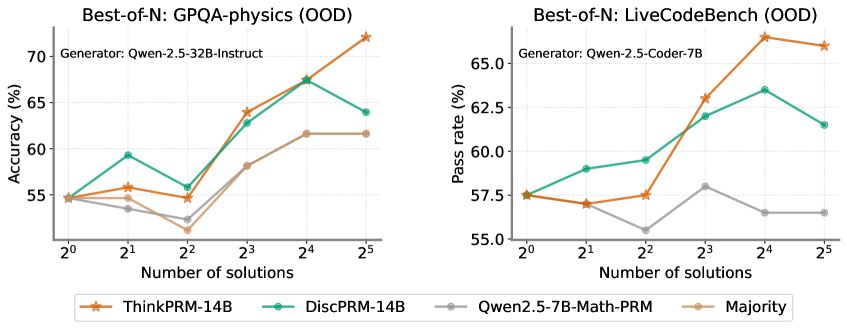
The image presents two line charts comparing the performance of different language models on two out-of-distribution (OOD) datasets: GPQA-physics and LiveCodeBench. The charts plot performance metrics (Accuracy for GPQA-physics and Pass Rate for LiveCodeBench) against the number of solutions generated by the models.
### Components/Axes
Both charts share the following components:
* **X-axis:** "Number of solutions" with markers at 2⁰, 2¹, 2², 2³, 2⁴, and 2⁵.
* **Y-axis:** The left chart displays "Accuracy (%)", ranging from approximately 54% to 72%. The right chart displays "Pass rate (%)", ranging from approximately 55% to 67%.
* **Legend:** Located at the bottom of each chart, identifying the different models/strategies:
* ThinkPRM-14B (Orange, dashed line)
* DiscPRM-14B (Green, solid line)
* Qwen2.5-7B-Math-PRM (Gray, dashed-dotted line)
* Majority (Gray, solid line)
* **Title:** Each chart has a title indicating the dataset being evaluated:
* Left Chart: "Best-of-N: GPQA-physics (OOD)"
* Right Chart: "Best-of-N: LiveCodeBench (OOD)"
* **Generator:** Each chart also indicates the generator used:
* Left Chart: "Generator: Qwen-2.5-32B-Instruct"
* Right Chart: "Generator: Qwen-2.5-Coder-7B"
### Detailed Analysis or Content Details
**Chart 1: GPQA-physics (OOD)**
* **ThinkPRM-14B (Orange):** Starts at approximately 54.5% at 2⁰, increases steadily to around 68% at 2⁴, and peaks at approximately 71.5% at 2⁵.
* **DiscPRM-14B (Green):** Begins at approximately 56% at 2⁰, rises to around 64% at 2³, then declines to approximately 62% at 2⁵.
* **Qwen2.5-7B-Math-PRM (Gray, dashed-dotted):** Starts at approximately 55% at 2⁰, increases to around 61% at 2⁴, and remains relatively stable at approximately 61% at 2⁵.
* **Majority (Gray, solid):** Starts at approximately 54% at 2⁰, increases to around 58% at 2³, and remains relatively stable at approximately 58% at 2⁵.
**Chart 2: LiveCodeBench (OOD)**
* **ThinkPRM-14B (Orange):** Starts at approximately 57.5% at 2⁰, increases to around 66% at 2⁴, and declines slightly to approximately 65% at 2⁵.
* **DiscPRM-14B (Green):** Begins at approximately 59% at 2⁰, rises to around 64% at 2³, and declines to approximately 62% at 2⁵.
* **Qwen2.5-7B-Math-PRM (Gray, dashed-dotted):** Starts at approximately 57.5% at 2⁰, increases to around 61% at 2³, and declines to approximately 58% at 2⁵.
* **Majority (Gray, solid):** Starts at approximately 55% at 2⁰, increases to around 59% at 2³, and remains relatively stable at approximately 58% at 2⁵.
### Key Observations
* In both charts, ThinkPRM-14B generally outperforms the other models, especially at higher numbers of solutions (2⁴ and 2⁵).
* DiscPRM-14B shows an initial increase in performance but then plateaus or declines.
* Qwen2.5-7B-Math-PRM and Majority consistently perform at a lower level than ThinkPRM-14B and DiscPRM-14B.
* The performance gap between the models tends to widen as the number of solutions increases.
### Interpretation
The data suggests that increasing the number of solutions generated by the models can improve performance on both GPQA-physics and LiveCodeBench datasets. ThinkPRM-14B appears to be the most effective strategy, benefiting significantly from generating more solutions. The decline in performance for DiscPRM-14B after 2³ might indicate a point of diminishing returns or potential overfitting to the generated solutions. The relatively stable performance of the Majority baseline suggests that simply selecting the most frequent solution doesn't yield the same benefits as more sophisticated generation and selection strategies. The difference in performance between the two generators (Qwen-2.5-32B-Instruct for GPQA-physics and Qwen-2.5-Coder-7B for LiveCodeBench) suggests that the choice of generator is also important and may be task-dependent. The "Best-of-N" approach, where multiple solutions are generated and the best one is selected, is a promising technique for improving the performance of language models on challenging tasks. The OOD nature of the datasets highlights the importance of evaluating models on data that differs from their training distribution.