## Line Graphs: Best-of-N Performance Comparison (OOD Tasks)
### Overview
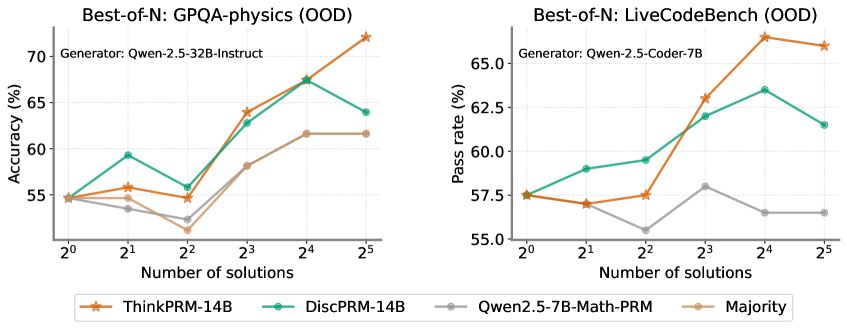
The image contains two line graphs comparing the performance of different AI models on out-of-distribution (OOD) tasks. The left graph evaluates physics problem-solving accuracy using the GPQA-physics benchmark, while the right graph measures code generation pass rates using the LiveCodeBench benchmark. Both graphs plot performance against the number of generated solutions (2⁰ to 2⁵).
### Components/Axes
**Left Graph (GPQA-physics):**
- **X-axis**: Number of solutions (2⁰ to 2⁵)
- **Y-axis**: Accuracy (%) [50-70% range]
- **Legend**:
- Orange stars: ThinkPRM-14B
- Teal circles: DiscPRM-14B
- Gray line: Qwen2.5-7B-Math-PRM
- Brown circles: Majority baseline
**Right Graph (LiveCodeBench):**
- **X-axis**: Number of solutions (2⁰ to 2⁵)
- **Y-axis**: Pass rate (%) [55-65% range]
- **Legend**:
- Orange stars: ThinkPRM-14B
- Teal circles: DiscPRM-14B
- Gray line: Qwen2.5-7B-Math-PRM
- Brown circles: Majority baseline
### Detailed Analysis
**Left Graph Trends:**
1. **ThinkPRM-14B** (orange):
- Starts at ~55% (2⁰), peaks at ~70% (2⁴), then drops to ~68% (2⁵)
- Shows strongest improvement with increasing solutions
2. **DiscPRM-14B** (teal):
- Follows similar trajectory: 55% → 64% → 68% → 63% (2⁵)
- Slight decline after 2⁴ suggests potential overfitting
3. **Qwen2.5-7B-Math-PRM** (gray):
- Starts at ~54%, peaks at ~61% (2⁴), drops to ~58% (2⁵)
- Less consistent improvement than PRM models
4. **Majority** (brown):
- Flat line at ~54-55% across all solution counts
**Right Graph Trends:**
1. **ThinkPRM-14B** (orange):
- Starts at ~55%, peaks at ~67.5% (2⁴), drops to ~66% (2⁵)
- Most significant improvement among methods
2. **DiscPRM-14B** (teal):
- 55% → 59% → 62% → 63% → 61% (2⁵)
- Steady improvement with minor regression at 2⁵
3. **Qwen2.5-7B-Math-PRM** (gray):
- Starts at ~54%, peaks at ~57.5% (2³), drops to ~53% (2⁵)
- Early peak suggests limited scalability
4. **Majority** (brown):
- Flat line at ~54-55% across all solution counts
### Key Observations
1. **Performance Scaling**: All methods show improved performance with increased solutions up to 2⁴, followed by declines at 2⁵
2. **Model Effectiveness**:
- ThinkPRM-14B consistently outperforms others in both tasks
- DiscPRM-14B shows strong second-place performance
- Majority baseline remains stagnant
3. **Task-Specific Behavior**:
- PRM models show more pronounced scaling in physics tasks
- Code generation tasks exhibit more stable improvement curves
4. **Diminishing Returns**: All methods show performance drops at 2⁵ solutions, suggesting potential overfitting or computational limits
### Interpretation
The data demonstrates that PRM-based models (ThinkPRM-14B and DiscPRM-14B) achieve superior performance on OOD tasks compared to specialized models (Qwen2.5-7B-Math-PRM) and simple majority voting. The consistent scaling pattern up to 2⁴ solutions suggests that generating multiple diverse solutions improves reasoning capabilities, but excessive sampling (2⁵) may introduce noise or redundant solutions that degrade performance. The stark contrast between PRM models and the Majority baseline highlights the importance of model architecture in handling OOD tasks. The performance drop at 2⁵ solutions across all methods warrants further investigation into optimal sampling strategies for complex reasoning tasks.