## Scatter Plot: Average Accuracy vs. Corpus Token Count
### Overview
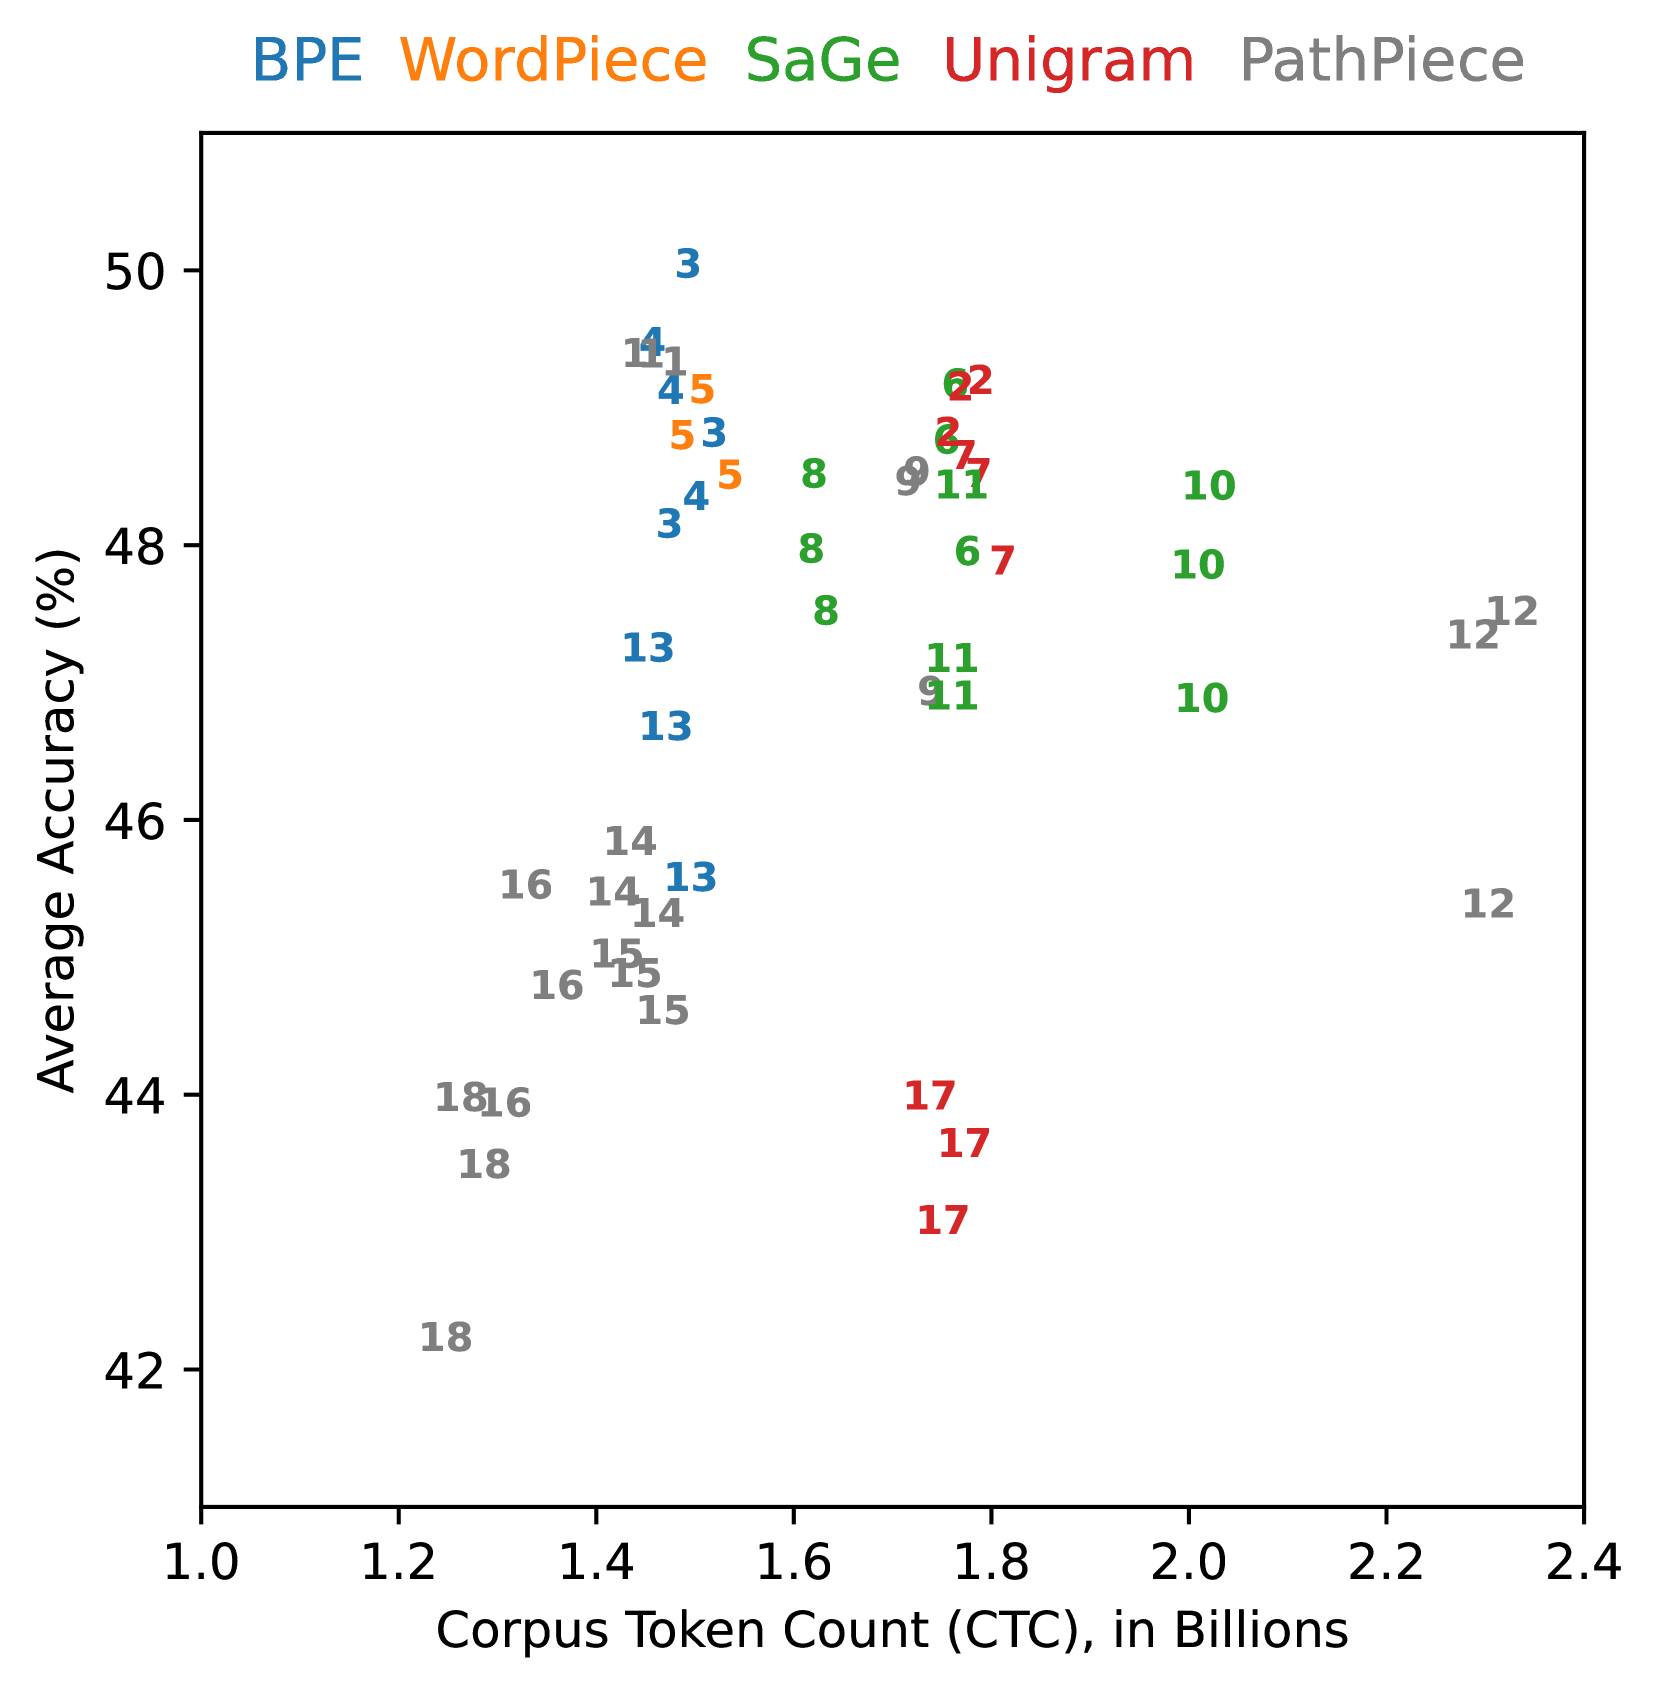
The image is a scatter plot comparing the average accuracy (%) of different tokenization methods (BPE, WordPiece, SaGe, Unigram, and PathPiece) against the corpus token count (CTC) in billions. Each data point is labeled with a number, presumably representing a specific experimental setting or dataset.
### Components/Axes
* **X-axis:** Corpus Token Count (CTC), in Billions. Scale ranges from 1.0 to 2.4, incrementing by 0.2.
* **Y-axis:** Average Accuracy (%). Scale ranges from 42 to 50, incrementing by 2.
* **Legend (Top):**
* BPE (Blue)
* WordPiece (Orange)
* SaGe (Green)
* Unigram (Red)
* PathPiece (Gray)
### Detailed Analysis
**BPE (Blue):**
* General Trend: Accuracy increases slightly with corpus token count, then decreases.
* Data Points:
* CTC ~1.4, Accuracy ~49.2, Labeled "1"
* CTC ~1.4, Accuracy ~48.2, Labeled "3"
* CTC ~1.4, Accuracy ~48.8, Labeled "4"
* CTC ~1.4, Accuracy ~46.0, Labeled "13"
**WordPiece (Orange):**
* General Trend: Accuracy increases slightly with corpus token count, then decreases.
* Data Points:
* CTC ~1.4, Accuracy ~49.0, Labeled "5"
* CTC ~1.5, Accuracy ~48.7, Labeled "5"
**SaGe (Green):**
* General Trend: Accuracy increases slightly with corpus token count, then decreases.
* Data Points:
* CTC ~1.6, Accuracy ~48.5, Labeled "8"
* CTC ~1.7, Accuracy ~48.7, Labeled "8"
* CTC ~1.7, Accuracy ~47.0, Labeled "8"
* CTC ~1.8, Accuracy ~48.8, Labeled "9"
* CTC ~2.0, Accuracy ~47.8, Labeled "10"
* CTC ~2.0, Accuracy ~47.0, Labeled "10"
* CTC ~2.0, Accuracy ~48.5, Labeled "10"
* CTC ~1.8, Accuracy ~46.8, Labeled "11"
**Unigram (Red):**
* General Trend: Accuracy increases slightly with corpus token count, then decreases.
* Data Points:
* CTC ~1.8, Accuracy ~49.0, Labeled "2"
* CTC ~1.8, Accuracy ~48.5, Labeled "2"
* CTC ~1.8, Accuracy ~48.0, Labeled "7"
* CTC ~1.8, Accuracy ~43.5, Labeled "17"
**PathPiece (Gray):**
* General Trend: Accuracy increases slightly with corpus token count, then decreases.
* Data Points:
* CTC ~1.2, Accuracy ~42.0, Labeled "18"
* CTC ~1.3, Accuracy ~44.0, Labeled "18"
* CTC ~1.4, Accuracy ~45.0, Labeled "14"
* CTC ~1.4, Accuracy ~44.8, Labeled "14"
* CTC ~1.4, Accuracy ~44.8, Labeled "15"
* CTC ~1.4, Accuracy ~44.5, Labeled "15"
* CTC ~1.4, Accuracy ~44.5, Labeled "16"
* CTC ~1.4, Accuracy ~44.0, Labeled "16"
* CTC ~1.8, Accuracy ~46.8, Labeled "11"
* CTC ~2.3, Accuracy ~47.2, Labeled "12"
* CTC ~2.3, Accuracy ~45.0, Labeled "12"
### Key Observations
* The data points are clustered, suggesting that the corpus token count has a limited impact on the average accuracy within the observed range.
* PathPiece (gray) generally has lower accuracy compared to the other methods.
* BPE, WordPiece, SaGe, and Unigram have similar accuracy ranges.
* The numbers labeling each point are not explained in the image, but they likely represent different experimental conditions or datasets.
### Interpretation
The scatter plot visualizes the relationship between corpus token count and average accuracy for different tokenization methods. The clustering of data points suggests that the choice of tokenization method has a more significant impact on accuracy than the size of the corpus (within the observed range of 1.0 to 2.4 billion tokens). PathPiece appears to be less accurate than the other methods. The specific experimental conditions or datasets represented by the numbered labels are not defined, limiting further interpretation.