## Scatter Plot: Average Accuracy vs. Corpus Token Count for Different Tokenization Methods
### Overview
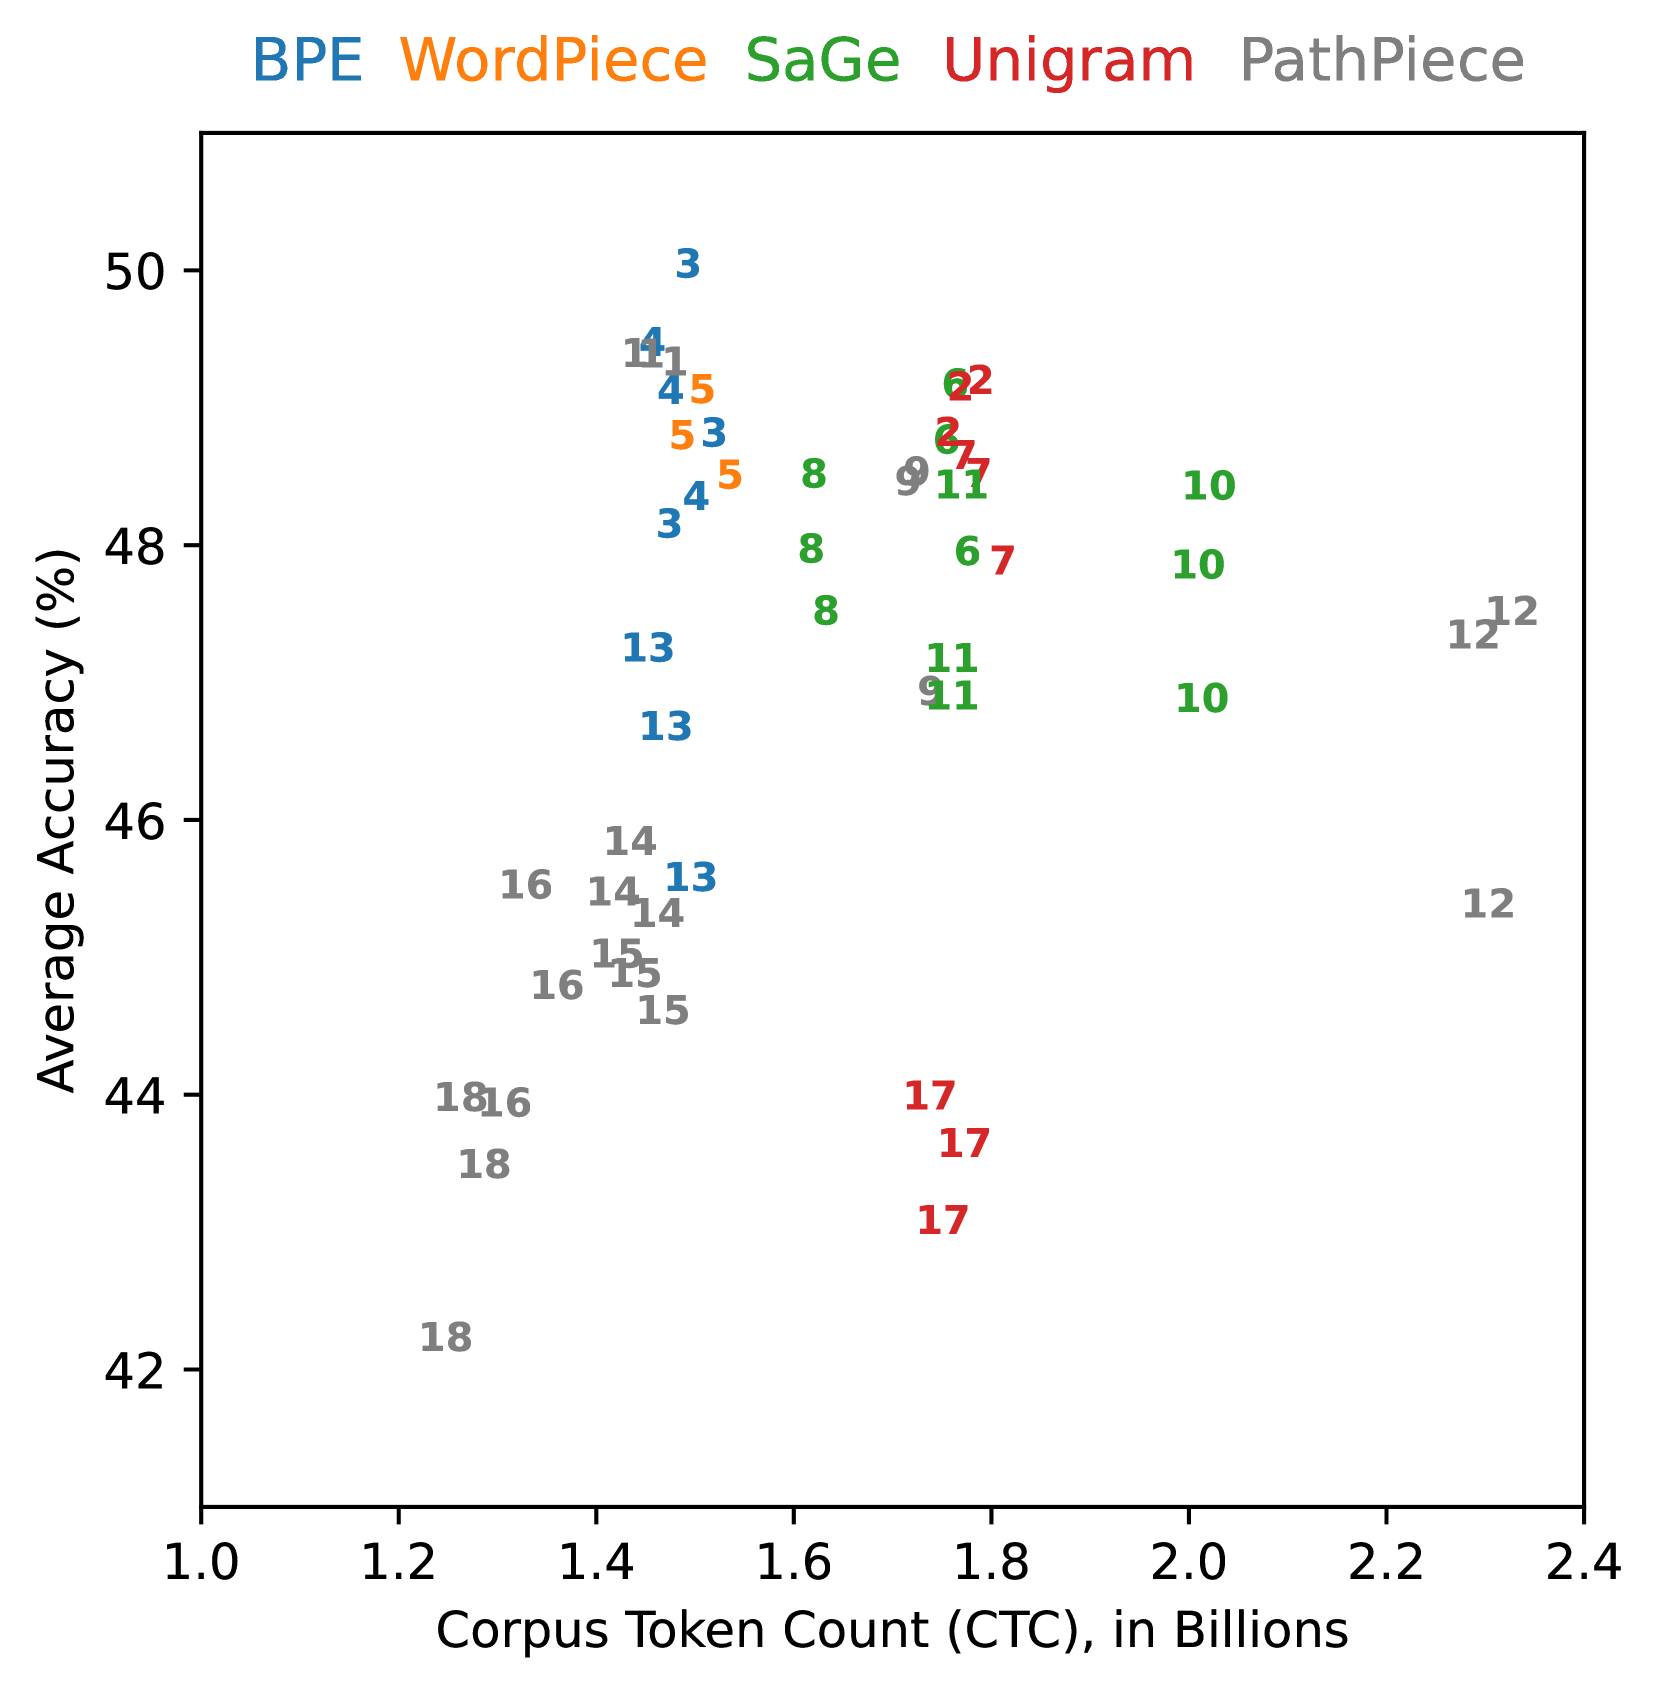
This scatter plot visualizes the relationship between average accuracy (in percentage) and corpus token count (in billions) for five different tokenization methods: BPE, WordPiece, SaGe, Unigram, and PathPiece. Each method is represented by a distinct color, and the plot shows how accuracy changes as the corpus token count increases. The data points are labeled with numerical values.
### Components/Axes
* **X-axis:** Corpus Token Count (CTC), in Billions. Scale ranges from 1.0 to 2.4.
* **Y-axis:** Average Accuracy (%). Scale ranges from 42% to 50%.
* **Legend (Top-Center):** Lists the five tokenization methods and their corresponding colors:
* BPE (Blue)
* WordPiece (Green)
* SaGe (Red)
* Unigram (Purple)
* PathPiece (Orange)
* **Data Points:** Scatter points representing the average accuracy for each tokenization method at different corpus token counts. Each point is labeled with a number.
### Detailed Analysis
Here's a breakdown of each tokenization method's trend and data points, verified by color matching with the legend:
* **BPE (Blue):** The blue line shows an upward trend, starting at approximately 44.5% accuracy at 1.2 billion tokens and reaching approximately 49.5% accuracy at 2.3 billion tokens.
* (1.2, 44.5) - Label: 18
* (1.3, 45.5) - Label: 16
* (1.4, 46.5) - Label: 14
* (1.5, 47.5) - Label: 15
* (1.6, 48.5) - Label: 8
* (1.7, 49.0) - Label: 9
* (1.8, 49.2) - Label: 11
* (1.9, 49.5) - Label: 10
* (2.0, 49.5) - Label: 10
* (2.1, 49.5) - Label: 12
* (2.2, 49.5) - Label: 12
* (2.3, 49.5) - Label: 12
* **WordPiece (Green):** The green line shows a generally upward trend, but with more fluctuations. It starts at approximately 44.5% accuracy at 1.2 billion tokens and reaches approximately 48.5% accuracy at 2.3 billion tokens.
* (1.3, 45.0) - Label: 13
* (1.4, 46.0) - Label: 14
* (1.5, 47.0) - Label: 14
* (1.6, 47.5) - Label: 8
* (1.7, 48.0) - Label: 11
* (1.8, 48.0) - Label: 11
* (1.9, 48.0) - Label: 10
* (2.0, 48.0) - Label: 10
* (2.1, 48.0) - Label: 12
* (2.2, 48.0) - Label: 12
* **SaGe (Red):** The red line shows a relatively stable trend, with a slight upward slope. It starts at approximately 43.5% accuracy at 1.2 billion tokens and reaches approximately 44.5% accuracy at 2.3 billion tokens.
* (1.2, 43.5) - Label: 18
* (1.3, 44.0) - Label: 16
* (1.4, 44.5) - Label: 14
* (1.5, 44.5) - Label: 15
* (1.6, 45.0) - Label: 8
* (1.7, 45.5) - Label: 17
* (1.8, 45.5) - Label: 17
* (1.9, 45.5) - Label: 17
* **Unigram (Purple):** The purple line shows a strong upward trend, starting at approximately 44.0% accuracy at 1.2 billion tokens and reaching approximately 50% accuracy at 2.3 billion tokens.
* (1.4, 46.0) - Label: 3
* (1.5, 47.0) - Label: 4
* (1.6, 48.0) - Label: 5
* (1.7, 48.5) - Label: 8
* (1.8, 49.0) - Label: 9
* (1.9, 49.5) - Label: 11
* (2.0, 49.5) - Label: 10
* (2.1, 49.5) - Label: 12
* (2.2, 49.5) - Label: 12
* **PathPiece (Orange):** The orange line shows a moderate upward trend, starting at approximately 44.0% accuracy at 1.2 billion tokens and reaching approximately 48.5% accuracy at 2.3 billion tokens.
* (1.5, 47.0) - Label: 3
* (1.6, 47.5) - Label: 4
* (1.7, 48.0) - Label: 8
* (1.8, 48.5) - Label: 8
* (1.9, 48.5) - Label: 7
* (2.0, 48.5) - Label: 10
* (2.1, 48.5) - Label: 12
* (2.2, 48.5) - Label: 12
### Key Observations
* Unigram consistently demonstrates the highest average accuracy across all corpus token counts.
* SaGe exhibits the lowest average accuracy and the flattest trend, indicating minimal improvement with increasing corpus size.
* BPE and PathPiece show similar performance, with moderate improvements in accuracy as the corpus token count increases.
* WordPiece shows a fluctuating trend, with accuracy gains that are less consistent than BPE or PathPiece.
* The data points are clustered, suggesting that the performance of these tokenization methods is relatively consistent within specific ranges of corpus token counts.
### Interpretation
The data suggests that the choice of tokenization method significantly impacts the average accuracy of a model, particularly as the size of the training corpus increases. Unigram appears to be the most effective method for achieving high accuracy, while SaGe may be less suitable for large-scale datasets. The upward trends observed for most methods indicate that increasing the corpus token count generally leads to improved accuracy, but the rate of improvement varies depending on the tokenization method. The clustering of data points suggests that the performance of each method is relatively stable within certain ranges of corpus size. The numerical labels on the data points could represent individual experiment runs or model iterations, allowing for a more detailed analysis of the variability in performance. The fact that the accuracy plateaus for some methods at higher token counts suggests that there may be diminishing returns to increasing the corpus size beyond a certain point.