## Scatter Plot: Model Performance vs. Corpus Token Count
### Overview
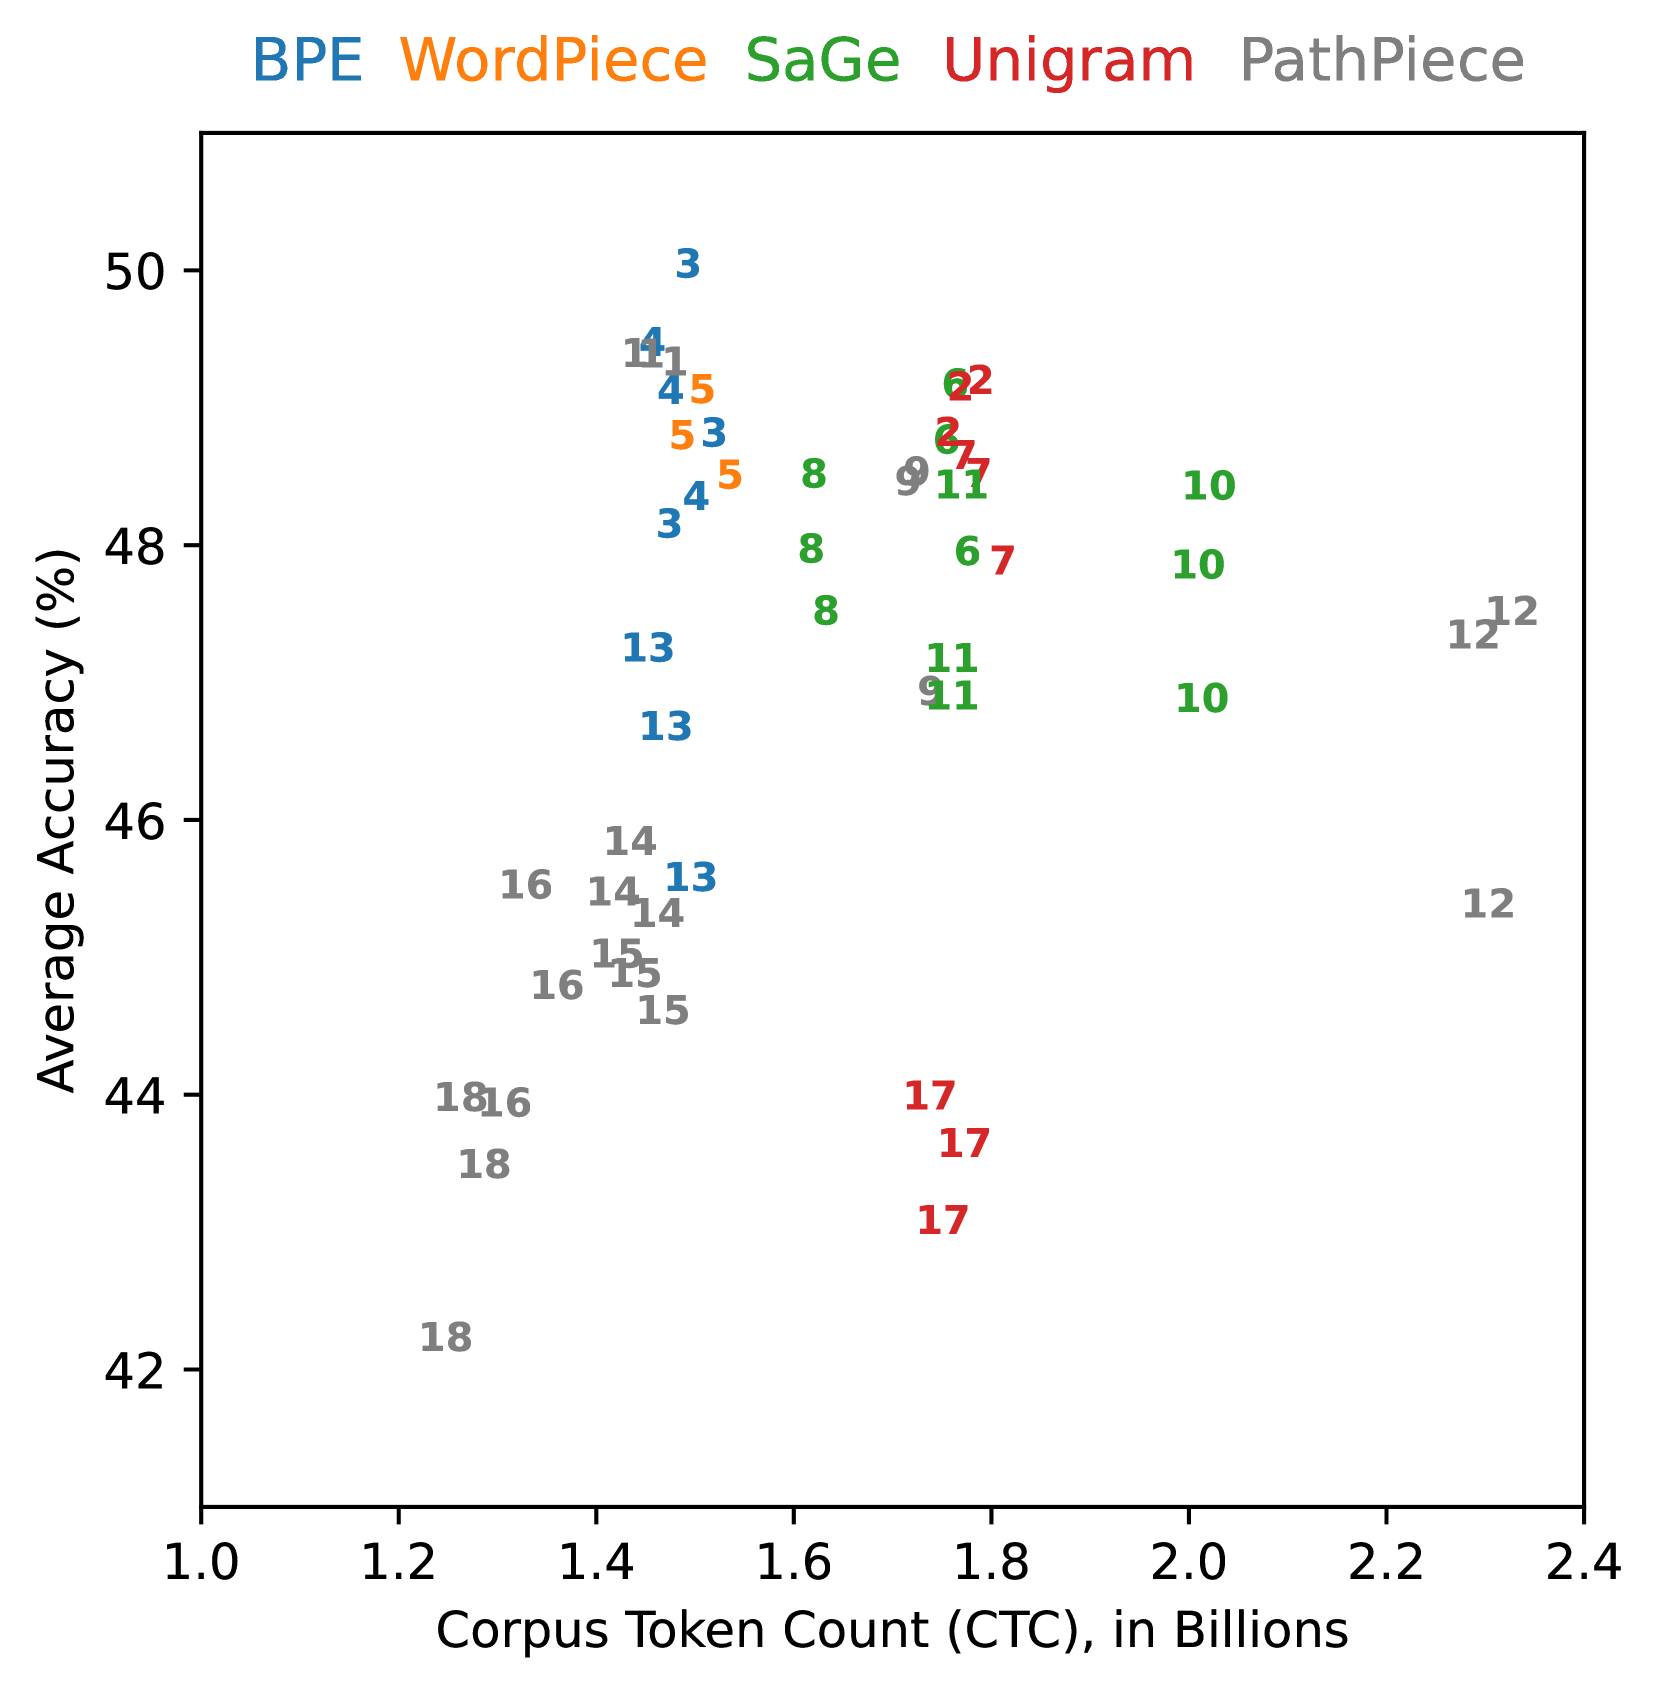
The image is a scatter plot comparing the **Average Accuracy (%)** of different language models against their **Corpus Token Count (CTC) in Billions**. Five models are represented by distinct colors: BPE (blue), WordPiece (orange), SaGe (green), Unigram (red), and PathPiece (gray). Data points are labeled with numerical identifiers (e.g., "3", "14", "17") and positioned across the plot.
### Components/Axes
- **X-axis**: Corpus Token Count (CTC), in Billions (range: 1.0 to 2.4).
- **Y-axis**: Average Accuracy (%), ranging from 42% to 50%.
- **Legend**: Located at the top, with color-coded labels for each model.
- **Data Points**: Labeled with numbers (e.g., "3", "14", "17") and colored according to the legend.
### Detailed Analysis
#### BPE (Blue)
- Data points: (1.4, 49), (1.5, 48), (1.6, 47), (1.7, 46), (1.8, 45).
- Trend: Accuracy decreases slightly as token count increases.
#### WordPiece (Orange)
- Data points: (1.3, 48), (1.4, 47), (1.5, 46), (1.6, 45), (1.7, 44).
- Trend: Similar to BPE, with a gradual decline in accuracy.
#### SaGe (Green)
- Data points: (1.6, 48), (1.7, 47), (1.8, 46), (1.9, 45), (2.0, 44).
- Trend: Accuracy decreases as token count increases.
#### Unigram (Red)
- Data points: (1.7, 47), (1.8, 46), (1.9, 45), (2.0, 44), (2.1, 43).
- Trend: Accuracy declines with increasing token count.
#### PathPiece (Gray)
- Data points: (1.8, 46), (1.9, 45), (2.0, 44), (2.1, 43), (2.2, 42).
- Trend: Accuracy decreases as token count increases.
### Key Observations
1. **BPE and WordPiece** (blue/orange) achieve the highest accuracy (45–49%) with lower token counts (1.3–1.8 billion).
2. **SaGe and Unigram** (green/red) show moderate accuracy (44–48%) with higher token counts (1.6–2.1 billion).
3. **PathPiece** (gray) has the lowest accuracy (42–46%) and requires the highest token counts (1.8–2.2 billion).
4. **Outliers**: No significant outliers; all data points follow a consistent downward trend for each model.
### Interpretation
The data suggests that **BPE and WordPiece models** are more efficient, achieving higher accuracy with fewer tokens. In contrast, **PathPiece** requires significantly more tokens for lower accuracy, indicating potential inefficiency. The trend across all models shows a trade-off between token count and accuracy, with no model maintaining high accuracy at very high token counts. This could imply that larger token counts do not necessarily correlate with better performance, highlighting the importance of model architecture and training data quality.