## Line Chart: Mean Pass Rate vs. Mean Number of Tokens Generated
### Overview
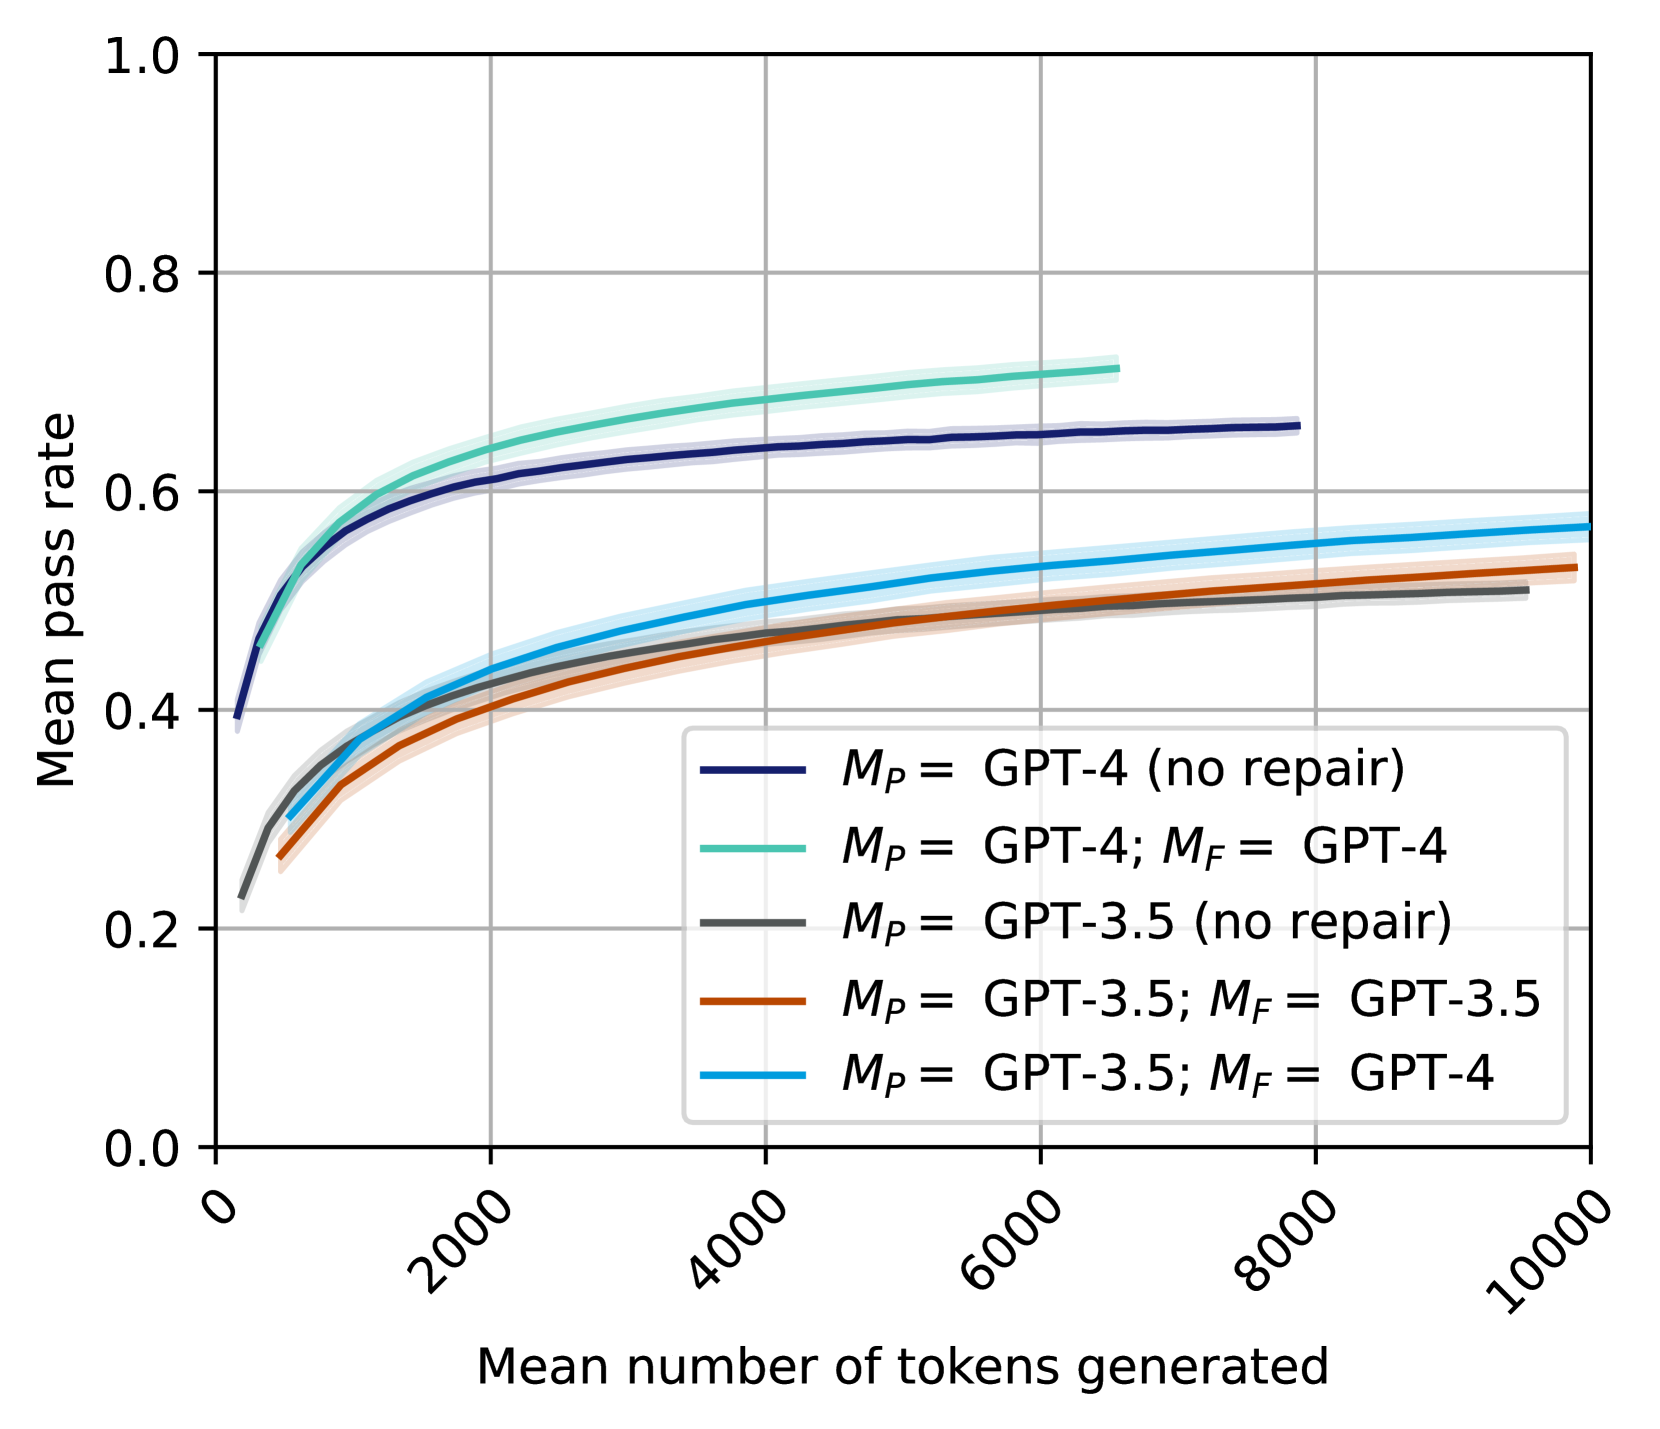
The image is a line chart comparing the mean pass rate against the mean number of tokens generated for different GPT models. The chart displays five different configurations, each represented by a distinct colored line, along with shaded regions indicating uncertainty. The x-axis represents the mean number of tokens generated, ranging from 0 to 10000. The y-axis represents the mean pass rate, ranging from 0.0 to 1.0.
### Components/Axes
* **X-axis:** "Mean number of tokens generated" with tick marks at 0, 2000, 4000, 6000, 8000, and 10000.
* **Y-axis:** "Mean pass rate" with tick marks at 0.0, 0.2, 0.4, 0.6, 0.8, and 1.0.
* **Legend:** Located in the bottom-right quadrant of the chart, it identifies each line by color and corresponding model configuration:
* Dark Blue: *M<sub>P</sub>* = GPT-4 (no repair)
* Light Green: *M<sub>P</sub>* = GPT-4; *M<sub>F</sub>* = GPT-4
* Gray: *M<sub>P</sub>* = GPT-3.5 (no repair)
* Brown: *M<sub>P</sub>* = GPT-3.5; *M<sub>F</sub>* = GPT-3.5
* Light Blue: *M<sub>P</sub>* = GPT-3.5; *M<sub>F</sub>* = GPT-4
### Detailed Analysis
* **Dark Blue Line:** *M<sub>P</sub>* = GPT-4 (no repair)
* Trend: The line starts at approximately 0.4 at 0 tokens and increases rapidly, then plateaus around 0.65 at 6000 tokens, remaining relatively flat until 10000 tokens.
* Data Points: (0, 0.4), (2000, 0.6), (6000, 0.65), (10000, 0.65)
* **Light Green Line:** *M<sub>P</sub>* = GPT-4; *M<sub>F</sub>* = GPT-4
* Trend: The line starts at approximately 0.4 at 0 tokens and increases rapidly, then plateaus around 0.7 at 6000 tokens, remaining relatively flat until 10000 tokens.
* Data Points: (0, 0.4), (2000, 0.65), (6000, 0.7), (10000, 0.7)
* **Gray Line:** *M<sub>P</sub>* = GPT-3.5 (no repair)
* Trend: The line starts at approximately 0.25 at 0 tokens and increases rapidly, then plateaus around 0.5 at 6000 tokens, remaining relatively flat until 10000 tokens.
* Data Points: (0, 0.25), (2000, 0.4), (6000, 0.5), (10000, 0.5)
* **Brown Line:** *M<sub>P</sub>* = GPT-3.5; *M<sub>F</sub>* = GPT-3.5
* Trend: The line starts at approximately 0.25 at 0 tokens and increases rapidly, then plateaus around 0.52 at 6000 tokens, remaining relatively flat until 10000 tokens.
* Data Points: (0, 0.25), (2000, 0.42), (6000, 0.52), (10000, 0.52)
* **Light Blue Line:** *M<sub>P</sub>* = GPT-3.5; *M<sub>F</sub>* = GPT-4
* Trend: The line starts at approximately 0.4 at 0 tokens and increases rapidly, then plateaus around 0.55 at 6000 tokens, remaining relatively flat until 10000 tokens.
* Data Points: (0, 0.4), (2000, 0.5), (6000, 0.55), (10000, 0.57)
### Key Observations
* GPT-4 models (dark blue and light green lines) generally outperform GPT-3.5 models (gray, brown, and light blue lines) in terms of mean pass rate.
* The "no repair" GPT-4 model (dark blue) performs slightly worse than the GPT-4 model with repair (light green).
* For GPT-3.5 models, using GPT-4 for repair (*M<sub>F</sub>* = GPT-4, light blue line) improves the mean pass rate compared to using GPT-3.5 for repair (*M<sub>F</sub>* = GPT-3.5, brown line) or no repair (gray line).
* All models show a rapid increase in mean pass rate with an increasing number of tokens generated up to around 6000 tokens, after which the rate of increase slows significantly.
### Interpretation
The data suggests that the GPT-4 models are more effective at generating correct outputs compared to the GPT-3.5 models, as indicated by their higher mean pass rates. Repair mechanisms, particularly using GPT-4 for repair, can improve the performance of both GPT-4 and GPT-3.5 models. The diminishing returns observed after 6000 tokens suggest that there is a point beyond which generating more tokens does not significantly improve the pass rate. This could be due to the models reaching a saturation point in their ability to correct errors or generate more accurate outputs.