\n
## Line Chart: Pass Rate vs. Tokens Generated for Language Models
### Overview
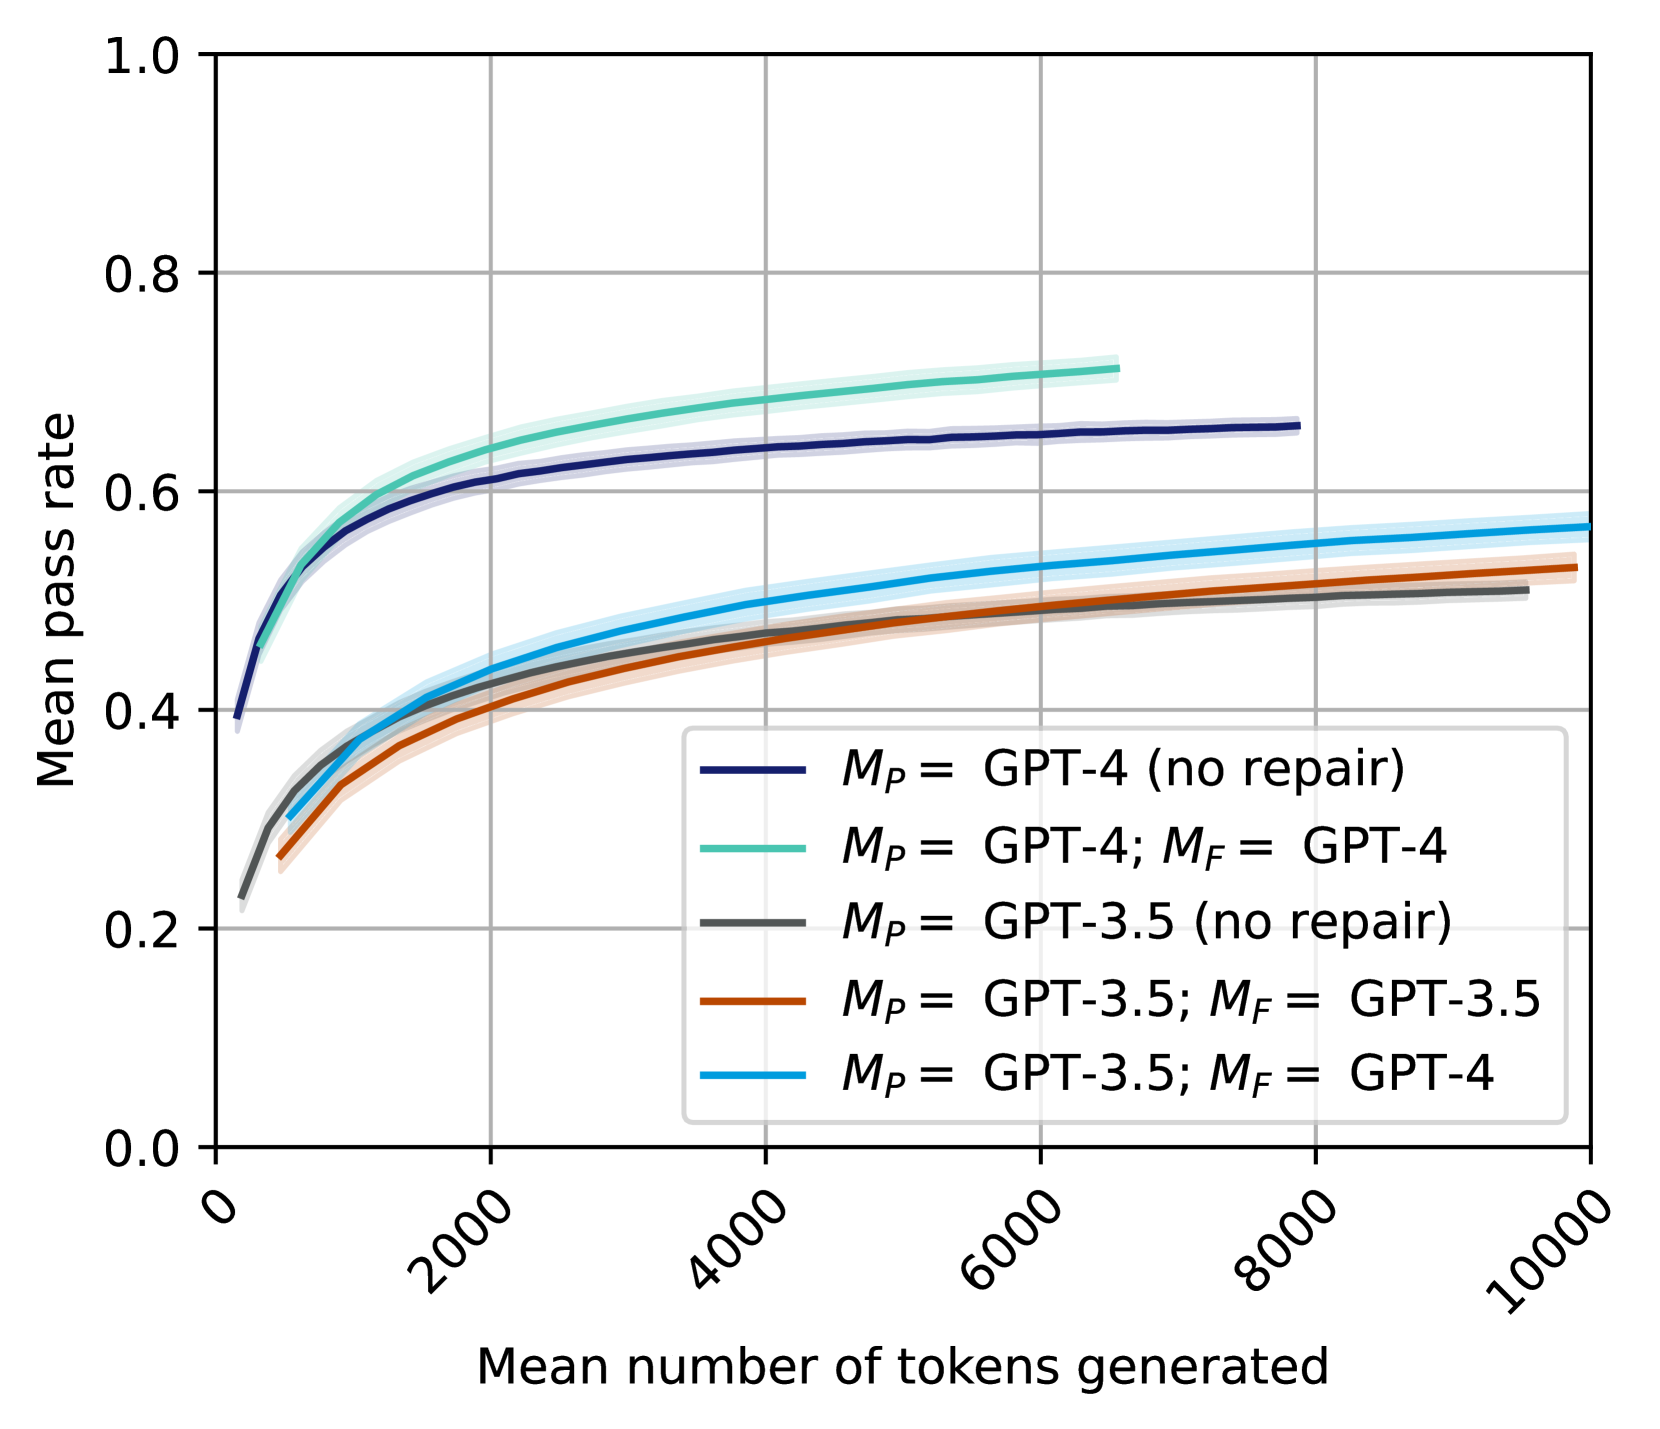
This line chart depicts the relationship between the mean number of tokens generated and the mean pass rate for several configurations of GPT-3.5 and GPT-4 language models, with and without a "repair" step (denoted as *M<sub>P</sub>* and *M<sub>F</sub>*). The chart aims to demonstrate how the performance (pass rate) of these models changes as they generate more text.
### Components/Axes
* **X-axis:** "Mean number of tokens generated". Scale ranges from 0 to 10000, with tick marks at 0, 2000, 4000, 6000, 8000, and 10000.
* **Y-axis:** "Mean pass rate". Scale ranges from 0.0 to 1.0, with tick marks at 0.0, 0.2, 0.4, 0.6, 0.8, and 1.0.
* **Legend:** Located in the bottom-right corner of the chart. Contains the following entries:
* Black line: *M<sub>P</sub>* = GPT-4 (no repair)
* Green line: *M<sub>P</sub>* = GPT-4; *M<sub>F</sub>* = GPT-4
* Gray line: *M<sub>P</sub>* = GPT-3.5 (no repair)
* Orange line: *M<sub>P</sub>* = GPT-3.5; *M<sub>F</sub>* = GPT-3.5
* Light blue line: *M<sub>P</sub>* = GPT-3.5; *M<sub>F</sub>* = GPT-4
### Detailed Analysis
Here's a breakdown of each line's trend and approximate data points:
* **GPT-4 (no repair) - Black Line:** The line starts at approximately (0, 0.15) and slopes upward, leveling off around (8000, 0.6). It shows a relatively rapid increase in pass rate for the first 2000 tokens, then a slower increase.
* **GPT-4; GPT-4 - Green Line:** This line begins at approximately (0, 0.25) and exhibits a consistent upward trend, reaching approximately (10000, 0.7). It consistently outperforms the "no repair" GPT-4.
* **GPT-3.5 (no repair) - Gray Line:** Starting at approximately (0, 0.1), the line increases gradually, reaching around (10000, 0.5). It shows a slower rate of improvement compared to the GPT-4 models.
* **GPT-3.5; GPT-3.5 - Orange Line:** This line starts at approximately (0, 0.2) and increases steadily, reaching approximately (10000, 0.55). It is consistently higher than the "no repair" GPT-3.5.
* **GPT-3.5; GPT-4 - Light Blue Line:** The line begins at approximately (0, 0.2) and increases, leveling off around (8000, 0.6). It shows a similar trend to the GPT-4 models, but starts at a lower pass rate.
### Key Observations
* GPT-4 consistently outperforms GPT-3.5 across all configurations.
* Adding a "repair" step (*M<sub>F</sub>*) consistently improves the pass rate for both GPT-3.5 and GPT-4.
* The improvement from the repair step is more pronounced for GPT-3.5 than for GPT-4.
* All lines exhibit diminishing returns in pass rate as the number of tokens generated increases. The rate of improvement slows down significantly after approximately 4000 tokens.
### Interpretation
The data suggests that GPT-4 is a more capable language model than GPT-3.5, as evidenced by its higher pass rates. The "repair" step, represented by *M<sub>F</sub>*, appears to be an effective technique for improving the quality of generated text, particularly for GPT-3.5. The diminishing returns observed at higher token counts indicate that there's a limit to how much improvement can be achieved by simply generating more text. The combination of GPT-3.5 as the initial model (*M<sub>P</sub>*) and GPT-4 for repair (*M<sub>F</sub>*) yields a performance level approaching that of GPT-4 with its own repair mechanism, suggesting a potential cost-effective strategy for enhancing model performance. The chart highlights the trade-off between model complexity, repair mechanisms, and the length of generated text in achieving a desired pass rate.