## Line Chart: Mean Pass Rate vs. Mean Number of Tokens Generated
### Overview
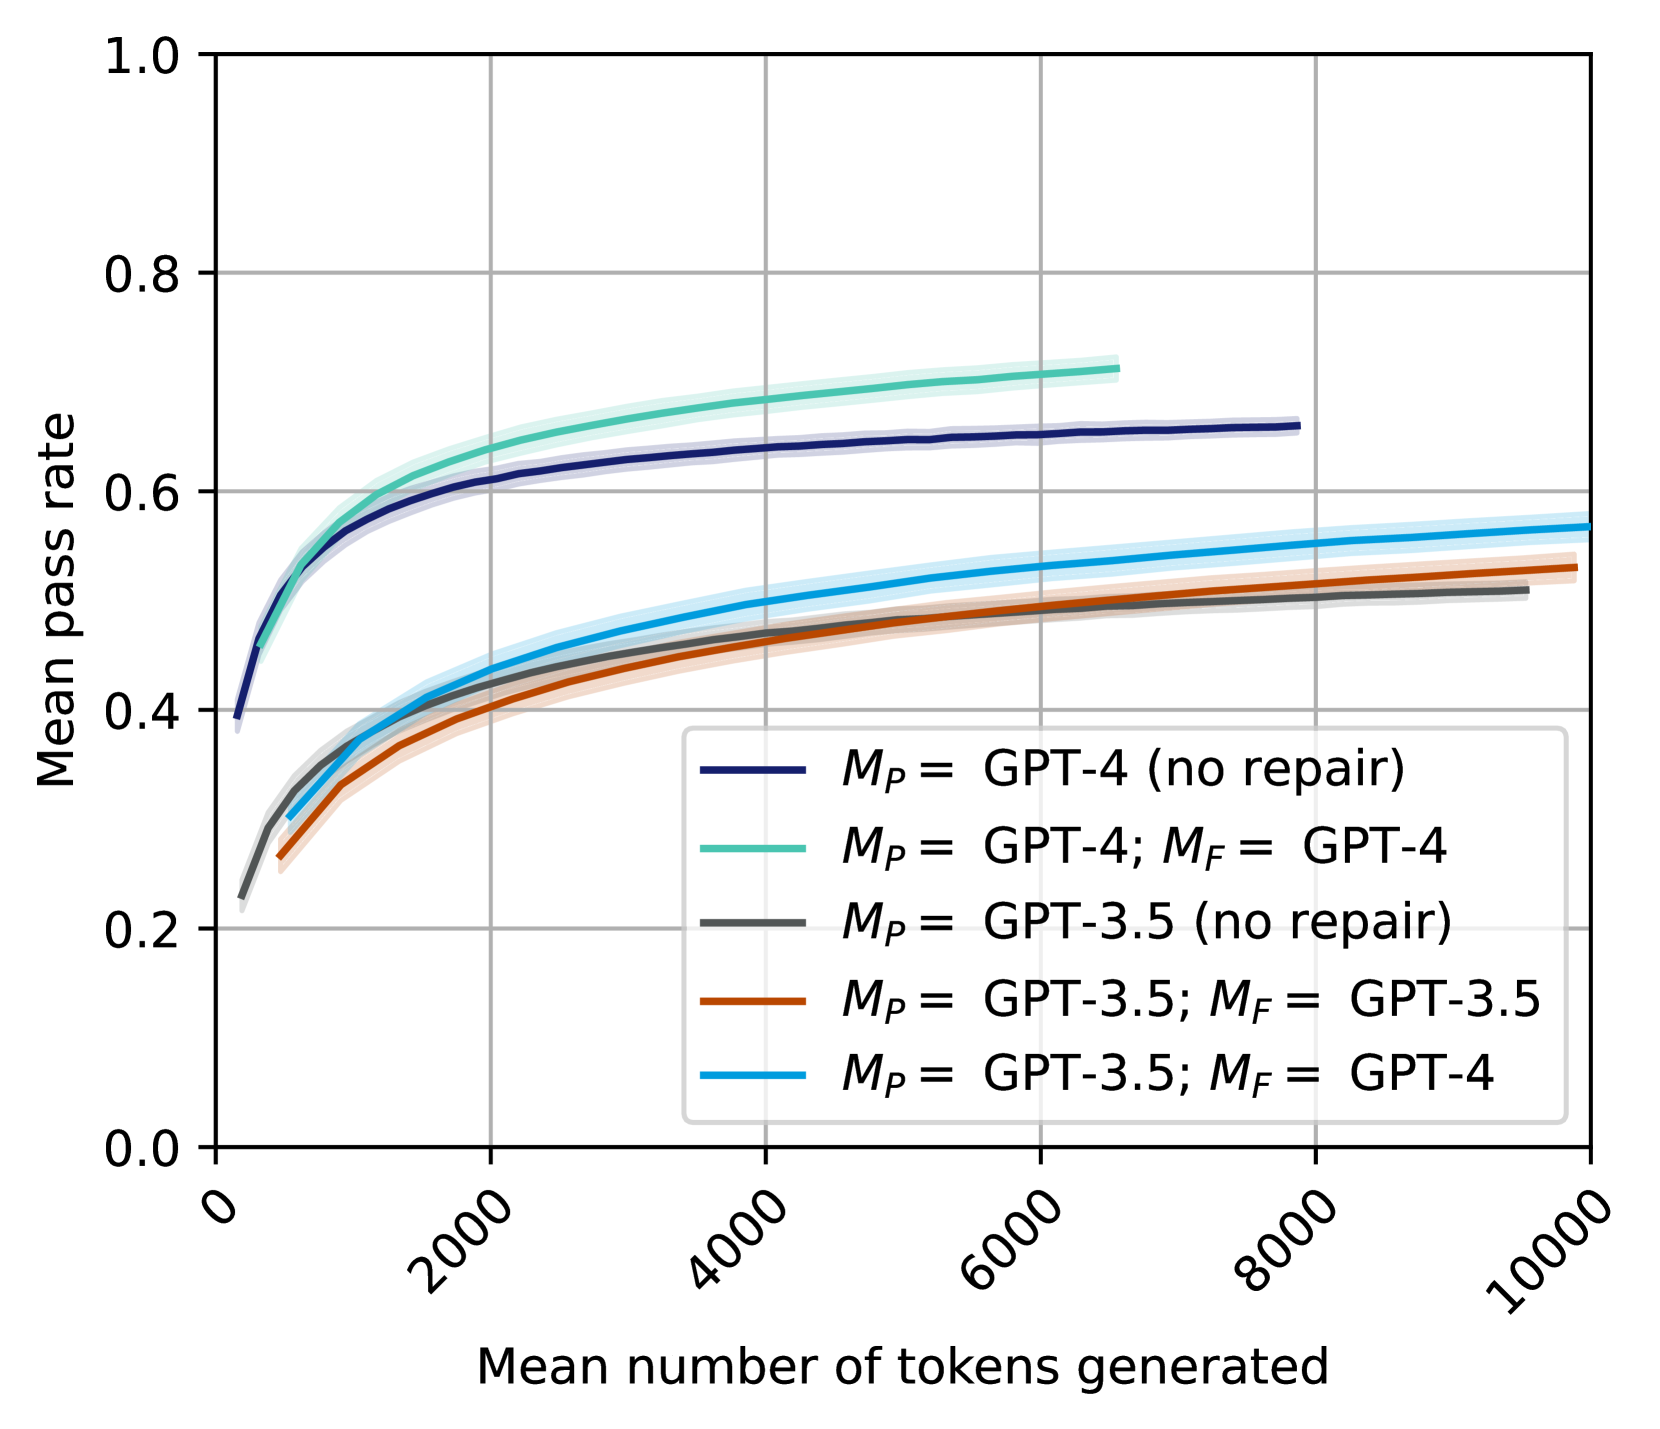
This is a line chart plotting the "Mean pass rate" against the "Mean number of tokens generated" for five different configurations of large language models (LLMs). The chart compares the performance of GPT-4 and GPT-3.5, both in standalone modes and with a "repair" mechanism ($M_F$) applied. The data is presented as smooth curves with shaded confidence intervals.
### Components/Axes
* **X-Axis (Horizontal):** Labeled "Mean number of tokens generated". The scale runs from 0 to 10,000, with major tick marks at 0, 2000, 4000, 6000, 8000, and 10000. The labels are rotated approximately 45 degrees.
* **Y-Axis (Vertical):** Labeled "Mean pass rate". The scale runs from 0.0 to 1.0, with major tick marks at 0.0, 0.2, 0.4, 0.6, 0.8, and 1.0.
* **Legend:** Positioned in the bottom-right quadrant of the chart area. It contains five entries, each with a colored line sample and a corresponding label:
1. **Dark Blue Line:** $M_P =$ GPT-4 (no repair)
2. **Teal/Green Line:** $M_P =$ GPT-4; $M_F =$ GPT-4
3. **Gray Line:** $M_P =$ GPT-3.5 (no repair)
4. **Orange Line:** $M_P =$ GPT-3.5; $M_F =$ GPT-3.5
5. **Light Blue Line:** $M_P =$ GPT-3.5; $M_F =$ GPT-4
* **Grid:** A light gray grid is present, aligned with the major tick marks on both axes.
### Detailed Analysis
The chart displays five distinct data series, each showing a logarithmic-like growth trend where the mean pass rate increases rapidly with initial token generation and then plateaus.
**Trend Verification & Data Points (Approximate):**
1. **$M_P =$ GPT-4 (no repair) [Dark Blue]:**
* **Trend:** Starts at a pass rate of ~0.4 at 0 tokens. Rises steeply, crossing 0.6 at ~2000 tokens, and continues a gradual ascent.
* **Endpoint:** At ~8000 tokens, the pass rate is approximately 0.66. This is the second-highest performing series.
2. **$M_P =$ GPT-4; $M_F =$ GPT-4 [Teal/Green]:**
* **Trend:** Follows a nearly identical path to the dark blue line but is consistently slightly higher. Starts at ~0.4, crosses 0.6 at ~1500 tokens.
* **Endpoint:** At its visible end (~6500 tokens), the pass rate is approximately 0.71. This is the highest-performing series overall.
3. **$M_P =$ GPT-3.5 (no repair) [Gray]:**
* **Trend:** Starts lower, at a pass rate of ~0.22 at 0 tokens. Rises steadily, crossing 0.4 at ~2000 tokens.
* **Endpoint:** At ~9000 tokens, the pass rate is approximately 0.51. This is the lowest-performing series.
4. **$M_P =$ GPT-3.5; $M_F =$ GPT-3.5 [Orange]:**
* **Trend:** Starts at a similar point to the gray line (~0.22). Initially tracks closely with the gray line but begins to slightly outperform it after ~2000 tokens.
* **Endpoint:** At 10,000 tokens, the pass rate is approximately 0.53.
5. **$M_P =$ GPT-3.5; $M_F =$ GPT-4 [Light Blue]:**
* **Trend:** Starts at ~0.22, similar to the other GPT-3.5 series. Shows a more pronounced improvement over the gray and orange lines, pulling ahead after ~1000 tokens.
* **Endpoint:** At 10,000 tokens, the pass rate is approximately 0.57. This is the highest-performing configuration using GPT-3.5 as the primary model ($M_P$).
### Key Observations
* **Performance Hierarchy:** The two GPT-4 primary model ($M_P$) configurations (dark blue, teal) significantly outperform all three GPT-3.5 primary model configurations across the entire token range.
* **Impact of Repair ($M_F$):** For both GPT-4 and GPT-3.5, adding a repair model ($M_F$) improves the mean pass rate compared to the "no repair" baseline. The improvement is more pronounced for GPT-3.5.
* **Cross-Model Repair Benefit:** The most effective repair configuration for a GPT-3.5 primary model is using GPT-4 as the repair model (light blue line), which yields a higher pass rate than using GPT-3.5 for repair (orange line).
* **Diminishing Returns:** All curves show strong diminishing returns; the gain in pass rate per additional token generated decreases substantially after the first 2000-4000 tokens.
* **Confidence Intervals:** The shaded areas around each line indicate uncertainty or variance. The intervals appear relatively narrow and consistent across the series, suggesting stable measurements.
### Interpretation
This chart demonstrates the relationship between computational cost (measured by tokens generated) and task success rate (pass rate) for different LLM setups. The data suggests several key insights:
1. **Model Capability is Primary:** The base capability of the primary model ($M_P$) is the strongest determinant of performance. GPT-4's inherent superiority over GPT-3.5 is clear, as even its "no repair" version outperforms all GPT-3.5 variants.
2. **Repair Mechanisms are Effective:** Implementing a repair or refinement step ($M_F$) consistently improves outcomes. This indicates that iterative or corrective processes add value beyond a single generation pass.
3. **Strategic Resource Allocation:** Using a more powerful model (GPT-4) as a repair agent for a weaker primary model (GPT-3.5) is a viable strategy to boost performance, potentially offering a cost-benefit trade-off compared to using the powerful model for the entire task.
4. **Efficiency Plateau:** The logarithmic trend implies that for any given model configuration, there is a point (around 4000-6000 tokens) where expending significantly more tokens yields only marginal improvements in pass rate. This has implications for optimizing token usage and cost in practical applications.
In summary, the chart provides a quantitative basis for choosing model configurations and token budgets, highlighting the trade-offs between model power, repair strategies, and computational efficiency.