## Line Graph: Mean Pass Rate
### Overview
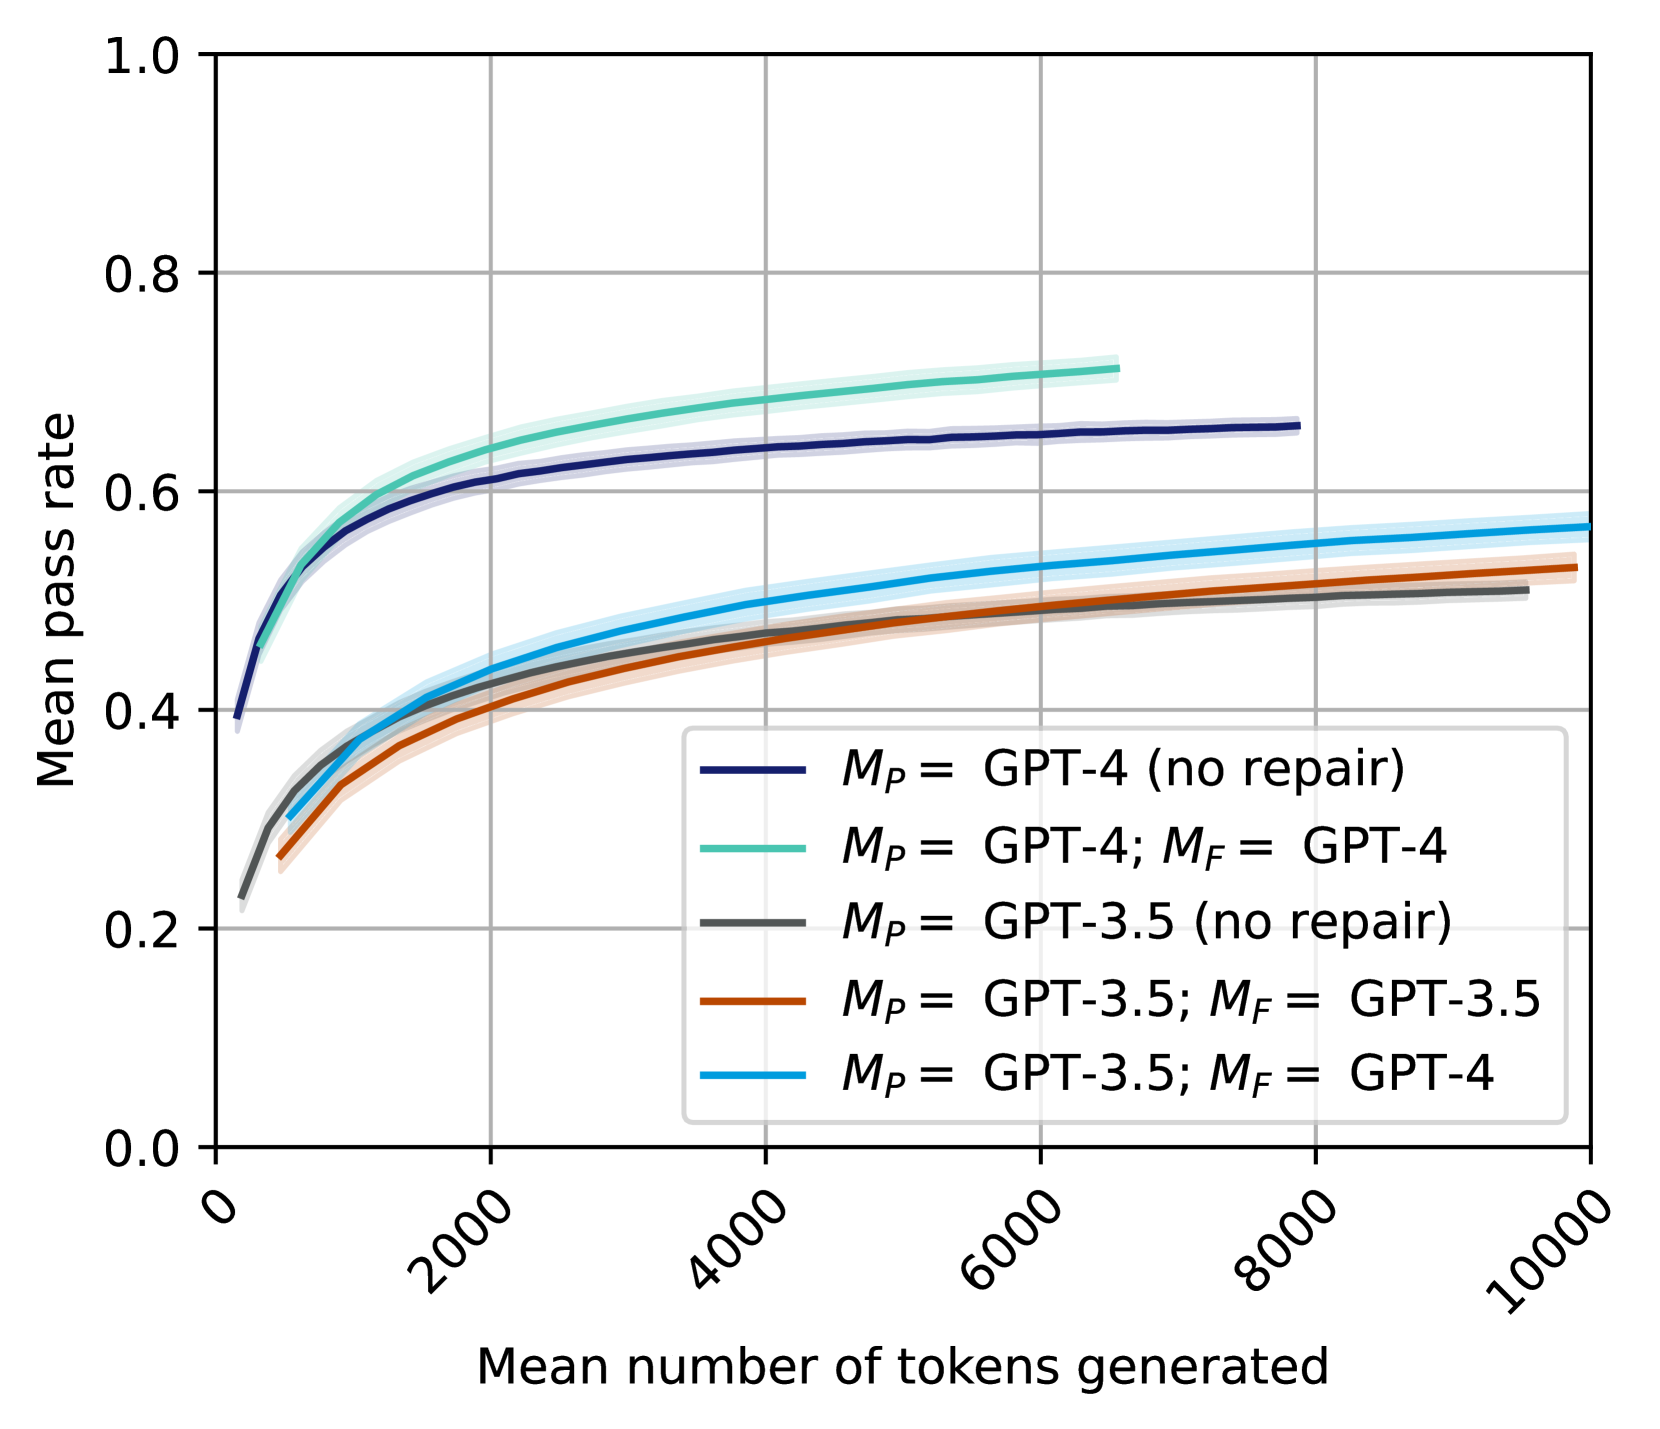
The line graph displays the mean pass rate of different models as a function of the mean number of tokens generated. The models compared are GPT-4, GPT-3.5, and their variants with and without repair.
### Components/Axes
- **X-axis**: Mean number of tokens generated
- **Y-axis**: Mean pass rate
- **Legend**:
- **M_p**: GPT-4 (no repair)
- **M_p**: GPT-4; M_F: GPT-4
- **M_p**: GPT-3.5 (no repair)
- **M_p**: GPT-3.5; M_F: GPT-3.5
- **M_p**: GPT-3.5; M_F: GPT-4
### Detailed Analysis or ### Content Details
- **GPT-4 (no repair)**: The line is the highest, indicating the highest mean pass rate. It starts at around 0.4 and increases to about 0.6 as the number of tokens generated increases.
- **GPT-4 (repair)**: The line is slightly lower than GPT-4 (no repair), starting at around 0.4 and increasing to about 0.55.
- **GPT-3.5 (no repair)**: The line is the lowest, starting at around 0.3 and increasing to about 0.45.
- **GPT-3.5 (repair)**: The line is the second lowest, starting at around 0.3 and increasing to about 0.4.
### Key Observations
- The models with repair consistently show a lower mean pass rate compared to their unrepaired counterparts.
- The difference in mean pass rate between GPT-4 (no repair) and GPT-4 (repair) is relatively small.
- The models with repair show a more gradual increase in mean pass rate as the number of tokens generated increases.
### Interpretation
The data suggests that the repair of the models does not significantly improve their mean pass rate. The models with repair show a similar trend to the unrepaired models, indicating that the repair does not provide a substantial advantage in this context. The slight increase in mean pass rate for the models with repair could be due to the fact that the repair process introduces some form of regularization or optimization that helps the model to generalize better. However, the improvement is not as significant as one might expect, which could be due to the complexity of the task or the specific characteristics of the data being generated.