## Line Chart: Efficiency vs. Node Size
### Overview
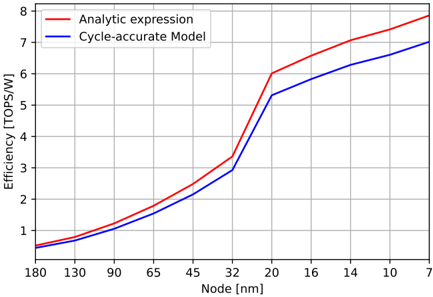
The image is a line chart comparing the efficiency (in TOPS/W) of two models, "Analytic expression" and "Cycle-accurate Model," across different node sizes (in nm). The chart shows how efficiency changes as node size decreases.
### Components/Axes
* **X-axis:** Node [nm]. The scale ranges from 7 to 180 nm, with markers at 7, 10, 14, 16, 20, 32, 45, 65, 90, 130, and 180.
* **Y-axis:** Efficiency [TOPS/W]. The scale ranges from 0 to 8, with markers at every integer value.
* **Legend:** Located in the top-left corner.
* Red line: "Analytic expression"
* Blue line: "Cycle-accurate Model"
### Detailed Analysis
* **Analytic expression (Red line):**
* Trend: Generally increasing as node size decreases.
* Data Points:
* 180 nm: ~0.5 TOPS/W
* 130 nm: ~0.7 TOPS/W
* 90 nm: ~1.1 TOPS/W
* 65 nm: ~1.6 TOPS/W
* 45 nm: ~2.3 TOPS/W
* 32 nm: ~3.4 TOPS/W
* 20 nm: ~6.0 TOPS/W
* 16 nm: ~6.5 TOPS/W
* 14 nm: ~6.8 TOPS/W
* 10 nm: ~7.1 TOPS/W
* 7 nm: ~7.4 TOPS/W
* **Cycle-accurate Model (Blue line):**
* Trend: Generally increasing as node size decreases, but consistently lower than the "Analytic expression" line.
* Data Points:
* 180 nm: ~0.4 TOPS/W
* 130 nm: ~0.6 TOPS/W
* 90 nm: ~0.9 TOPS/W
* 65 nm: ~1.3 TOPS/W
* 45 nm: ~1.9 TOPS/W
* 32 nm: ~2.9 TOPS/W
* 20 nm: ~5.3 TOPS/W
* 16 nm: ~6.0 TOPS/W
* 14 nm: ~6.2 TOPS/W
* 10 nm: ~6.6 TOPS/W
* 7 nm: ~7.0 TOPS/W
### Key Observations
* Both models show increasing efficiency as node size decreases.
* The "Analytic expression" model consistently shows higher efficiency than the "Cycle-accurate Model."
* The rate of increase in efficiency is more pronounced between 32 nm and 20 nm for both models.
### Interpretation
The chart suggests that smaller node sizes generally lead to higher efficiency in terms of TOPS/W. The "Analytic expression" model provides an optimistic estimate of efficiency, while the "Cycle-accurate Model" provides a more conservative estimate. The significant jump in efficiency between 32 nm and 20 nm indicates a potential technological shift or optimization in that range. The consistent difference between the two models suggests that the analytic expression may not fully capture all the factors affecting efficiency in a real-world implementation.