## Bar Chart: QuantBench cons@16
### Overview
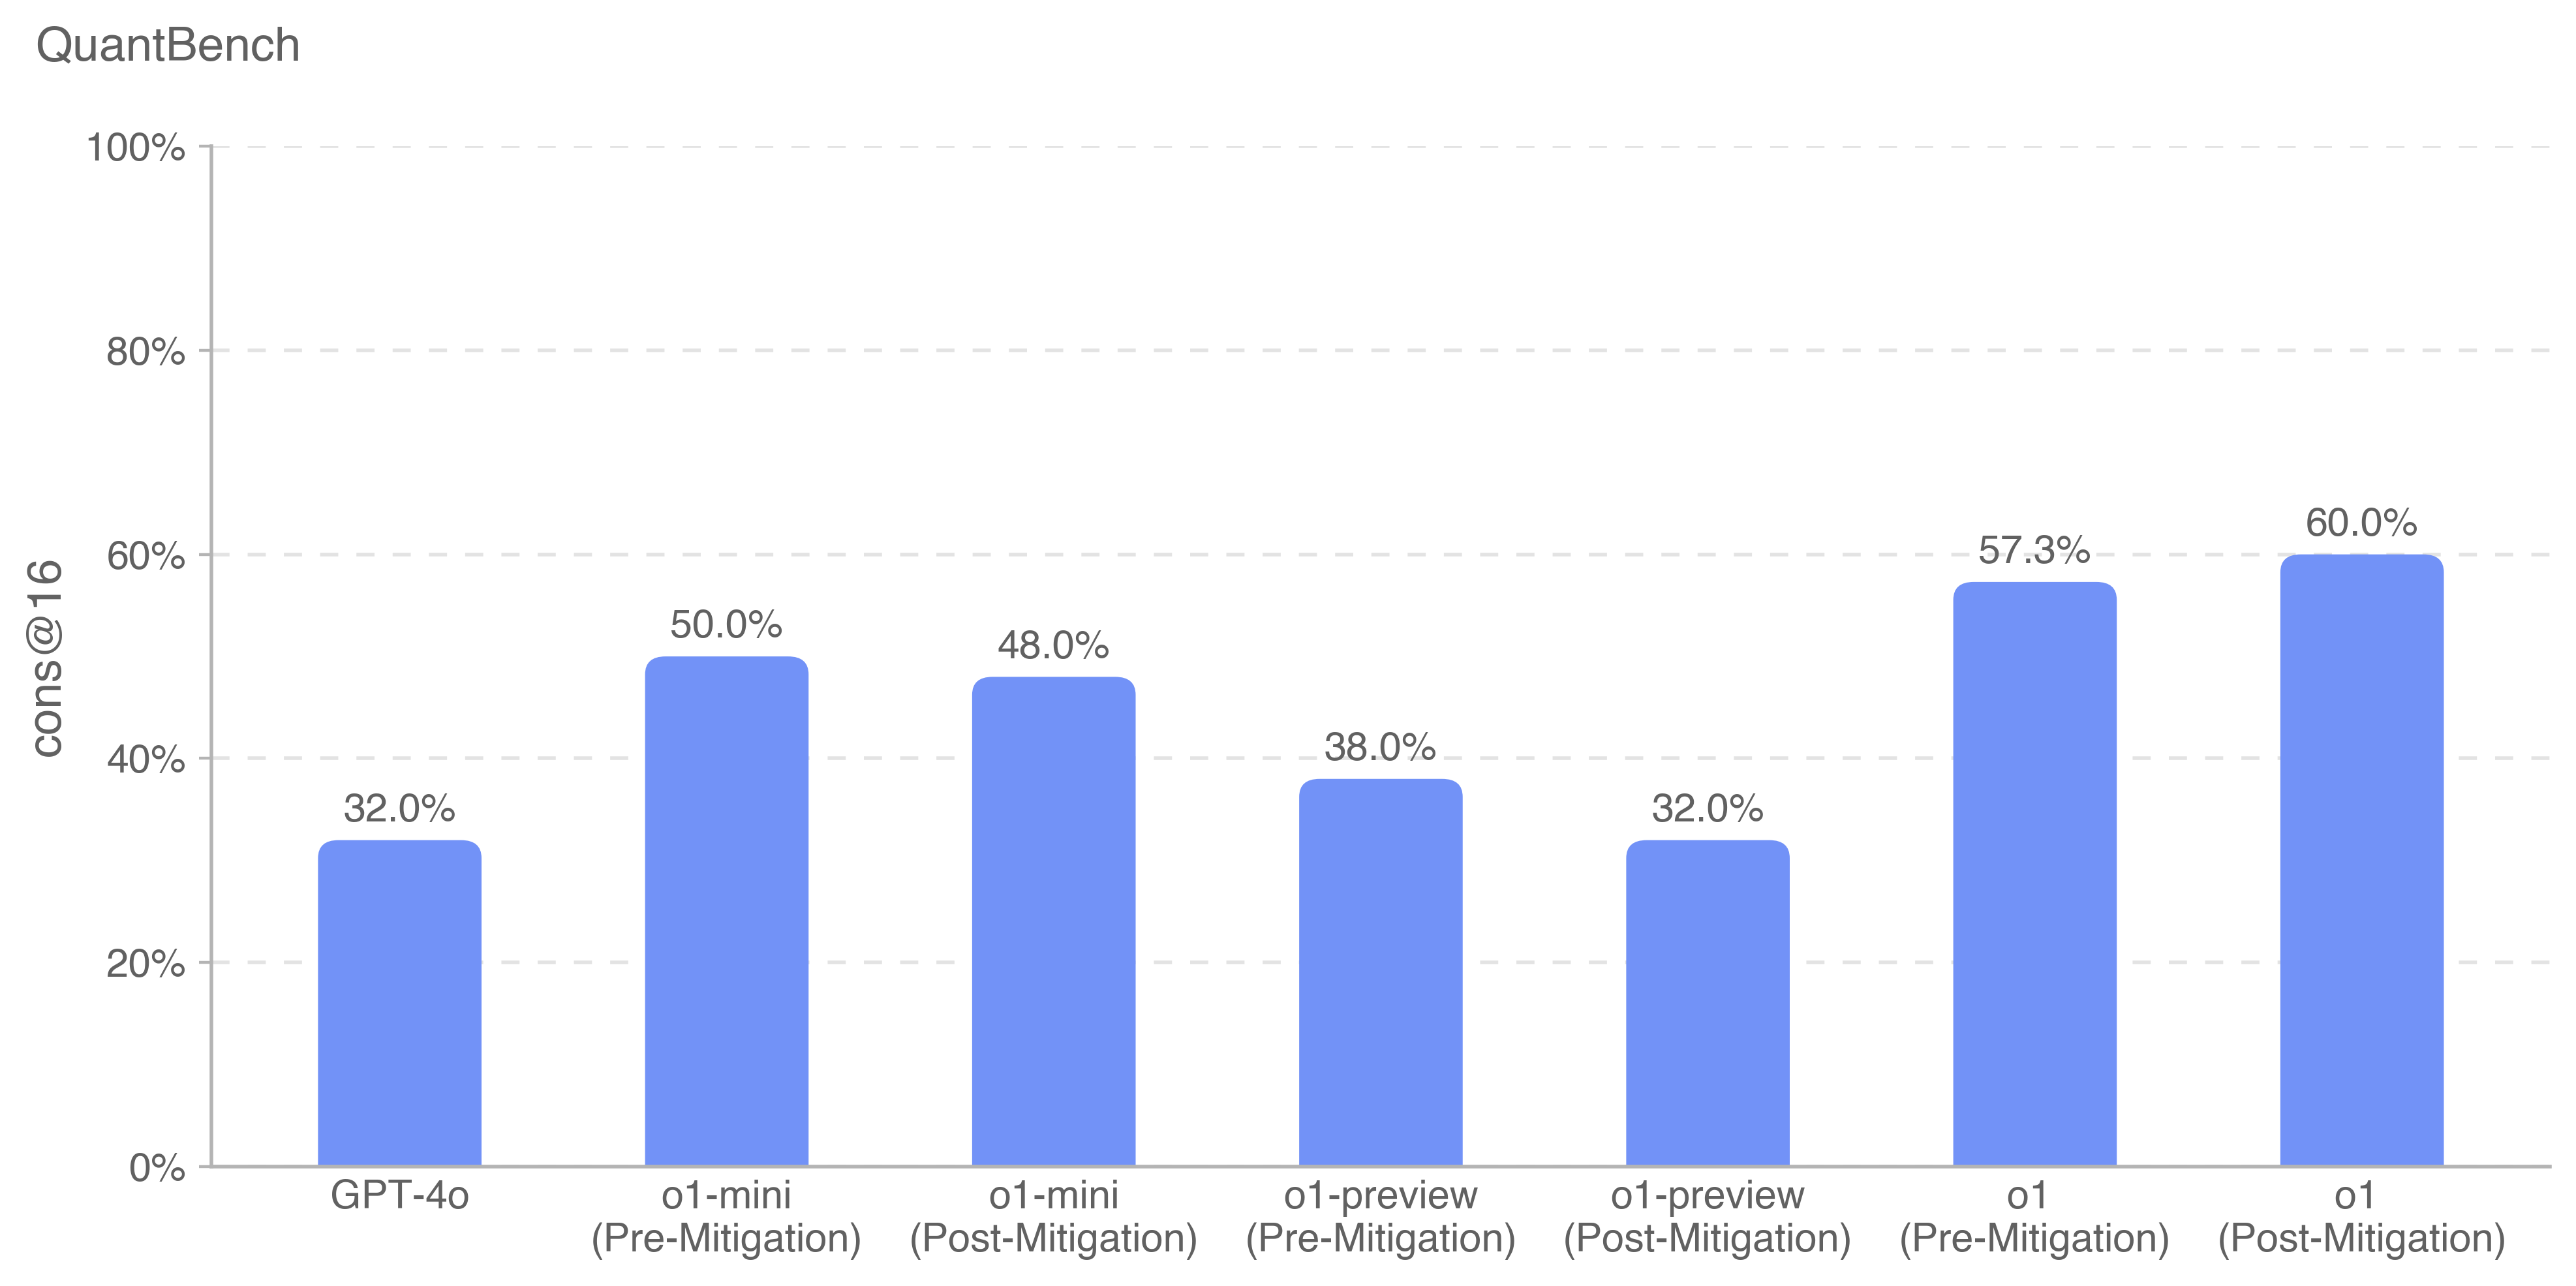
The image is a bar chart titled "QuantBench" displaying the "cons@16" metric for different models and mitigation strategies. The y-axis represents the percentage of "cons@16", ranging from 0% to 100%. The x-axis represents different models, including GPT-4o, o1-mini, o1-preview, and o1, each with pre-mitigation and post-mitigation data. All bars are a uniform light blue color.
### Components/Axes
* **Title:** QuantBench
* **Y-axis Label:** cons@16
* **Y-axis Scale:** 0%, 20%, 40%, 60%, 80%, 100%
* **X-axis Labels:**
* GPT-4o
* o1-mini (Pre-Mitigation)
* o1-mini (Post-Mitigation)
* o1-preview (Pre-Mitigation)
* o1-preview (Post-Mitigation)
* o1 (Pre-Mitigation)
* o1 (Post-Mitigation)
* **Bar Color:** Light Blue
### Detailed Analysis
* **GPT-4o:** 32.0%
* **o1-mini (Pre-Mitigation):** 50.0%
* **o1-mini (Post-Mitigation):** 48.0%
* **o1-preview (Pre-Mitigation):** 38.0%
* **o1-preview (Post-Mitigation):** 32.0%
* **o1 (Pre-Mitigation):** 57.3%
* **o1 (Post-Mitigation):** 60.0%
### Key Observations
* The "cons@16" metric varies across different models.
* Mitigation strategies have different effects on different models. For o1-mini and o1-preview, the "cons@16" metric decreases after mitigation. For o1, the "cons@16" metric increases after mitigation.
* The o1 model has the highest "cons@16" metric after mitigation (60.0%).
* The GPT-4o model has the lowest "cons@16" metric (32.0%).
### Interpretation
The bar chart compares the "cons@16" metric across different models and the impact of mitigation strategies. The data suggests that mitigation strategies can have varying effects depending on the model. For example, mitigation reduces "cons@16" for "o1-mini" and "o1-preview" but increases it for "o1". This indicates that the effectiveness of mitigation strategies is model-dependent. The "o1" model shows the highest "cons@16" after mitigation, while "GPT-4o" has the lowest, suggesting differences in their inherent characteristics or the way mitigation affects them.