\n
## Bar Chart: QuantBench cons@16 Performance
### Overview
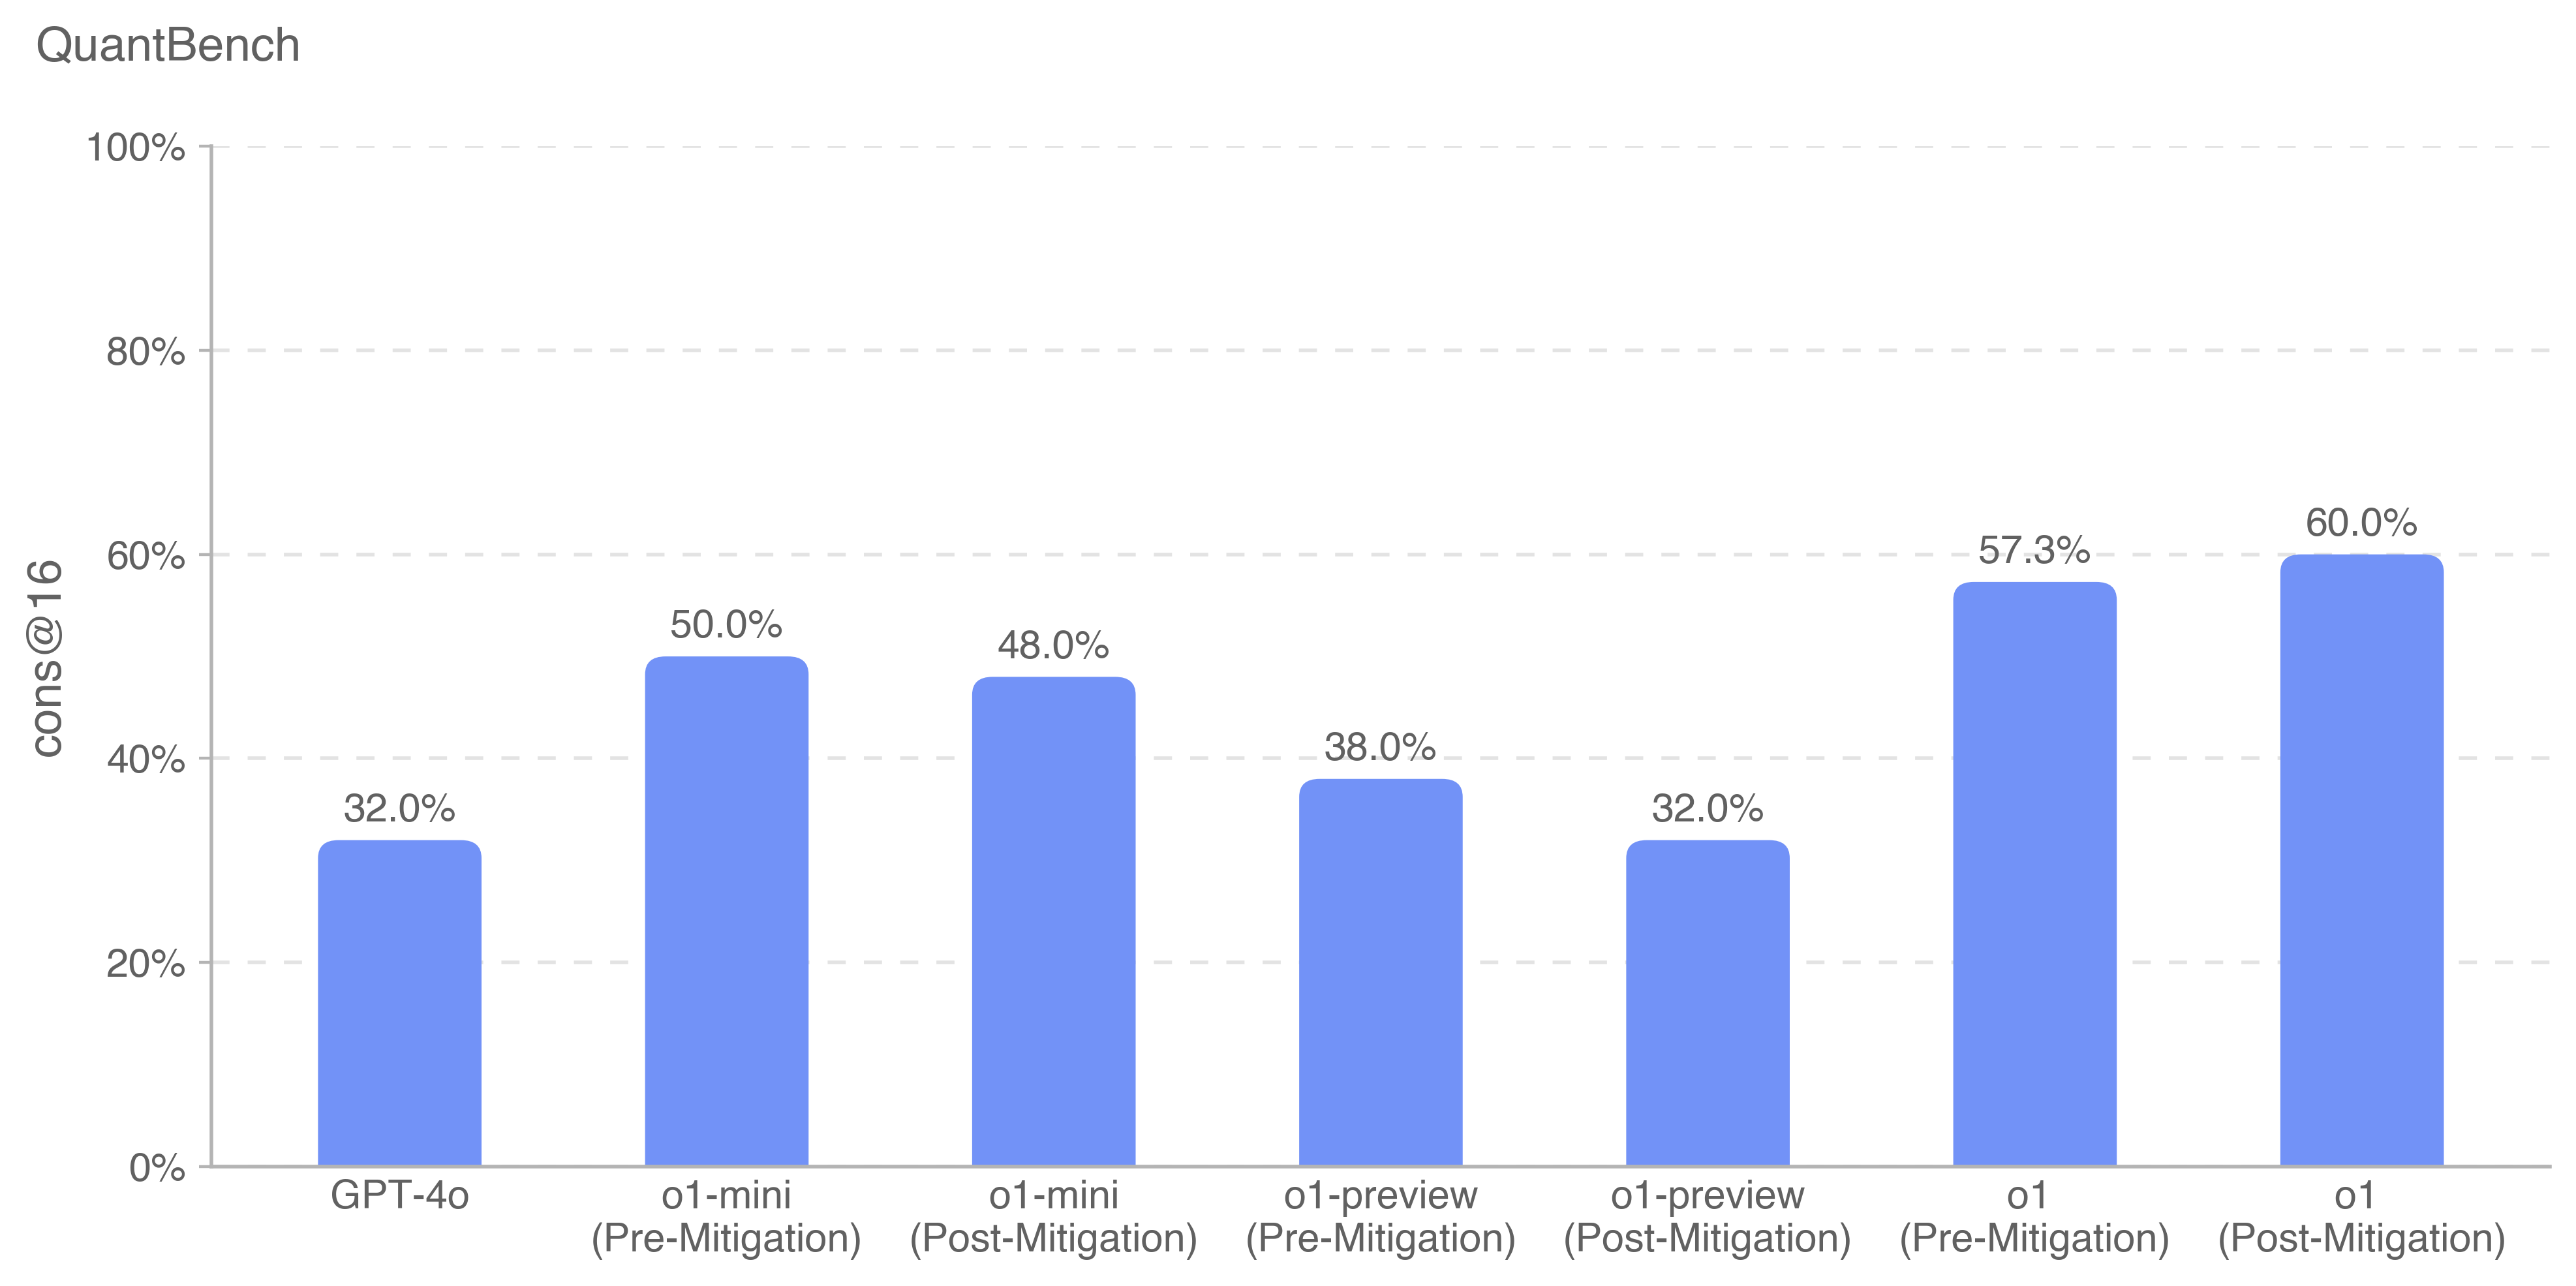
This bar chart displays the performance of different models (GPT-4o, o1-mini, o1-preview, o1) on the QuantBench benchmark, specifically measuring "cons@16". The chart compares performance *before* and *after* mitigation techniques were applied. The y-axis represents the percentage score, ranging from 0% to 100%.
### Components/Axes
* **Title:** QuantBench
* **Y-axis Label:** cons@16
* **X-axis Labels (Categories):**
* GPT-4o
* o1-mini (Pre-Mitigation)
* o1-mini (Post-Mitigation)
* o1-preview (Pre-Mitigation)
* o1-preview (Post-Mitigation)
* o1 (Pre-Mitigation)
* o1 (Post-Mitigation)
* **Y-axis Scale:** Linear, from 0% to 100%, with tick marks at 0%, 20%, 40%, 60%, 80%, and 100%. Horizontal dashed lines are present at each 20% increment.
* **Data Series:** Single series of bars, each representing a model and mitigation state. All bars are the same blue color.
### Detailed Analysis
The chart consists of seven bars, each representing a different model configuration.
1. **GPT-4o:** The bar reaches approximately 32.0%.
2. **o1-mini (Pre-Mitigation):** The bar reaches approximately 50.0%.
3. **o1-mini (Post-Mitigation):** The bar reaches approximately 48.0%.
4. **o1-preview (Pre-Mitigation):** The bar reaches approximately 38.0%.
5. **o1-preview (Post-Mitigation):** The bar reaches approximately 32.0%.
6. **o1 (Pre-Mitigation):** The bar reaches approximately 57.3%.
7. **o1 (Post-Mitigation):** The bar reaches approximately 60.0%.
The bars representing "Post-Mitigation" are generally slightly lower or higher than their "Pre-Mitigation" counterparts, indicating the effect of the mitigation techniques.
### Key Observations
* GPT-4o consistently shows the lowest performance among the models tested.
* The o1 model demonstrates the highest performance, particularly after mitigation.
* Mitigation appears to *improve* performance for the o1 model, but *decreases* performance for the o1-mini model.
* The difference between pre- and post-mitigation performance is relatively small for most models.
### Interpretation
The data suggests that the o1 model is the most capable on the QuantBench cons@16 benchmark. The application of mitigation techniques has a mixed effect, improving performance for the o1 model but slightly reducing it for the o1-mini model. This indicates that the optimal mitigation strategy may be model-specific. The relatively low performance of GPT-4o suggests it may be less suited for this particular benchmark or task. The chart highlights the importance of considering mitigation strategies when evaluating model performance, as they can significantly impact results. The fact that mitigation *decreased* performance for o1-mini suggests a potential trade-off or unintended consequence of the mitigation process for that model. Further investigation would be needed to understand why this occurred.