## Bar Chart: QuantBench Model Performance (cons@16)
### Overview
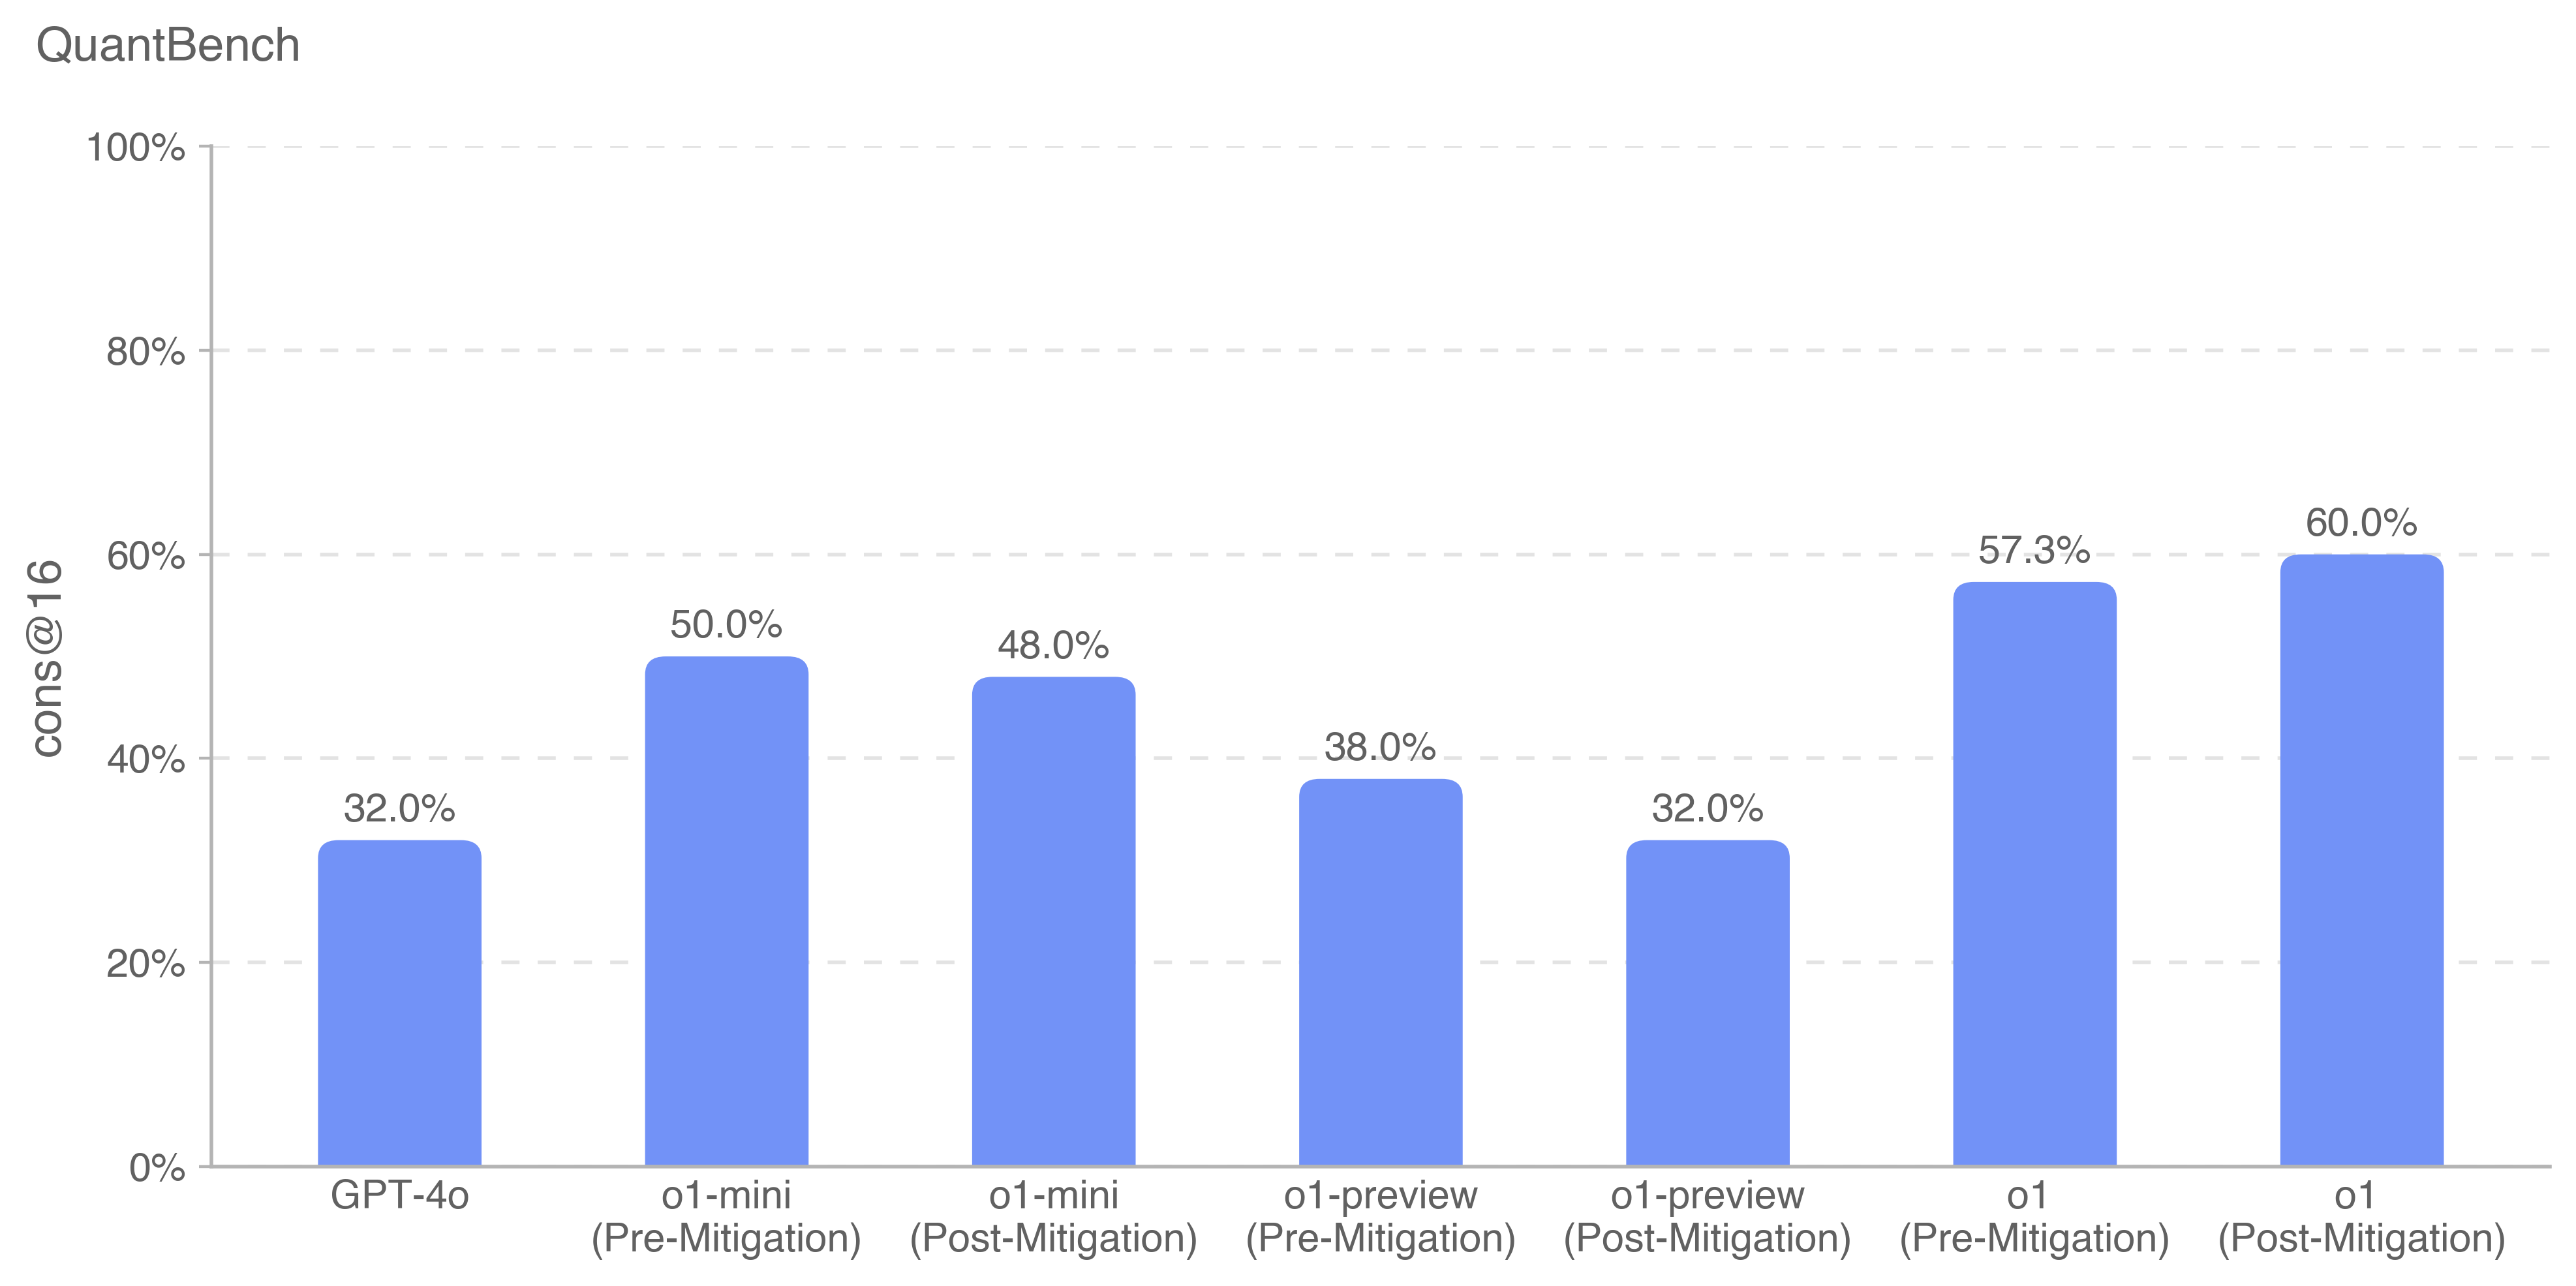
The image displays a vertical bar chart titled "QuantBench," comparing the performance of various AI models on a metric labeled "cons@16." The chart presents data for seven distinct model configurations, showing their percentage scores. The visual style is clean, with light blue bars against a white background and horizontal grid lines.
### Components/Axes
* **Chart Title:** "QuantBench" (located at the top-left).
* **Y-Axis:**
* **Label:** "cons@16" (rotated vertically on the left side).
* **Scale:** Percentage scale from 0% to 100%, with major tick marks and dashed grid lines at 20% intervals (0%, 20%, 40%, 60%, 80%, 100%).
* **X-Axis:**
* **Categories (from left to right):**
1. GPT-4o
2. o1-mini (Pre-Mitigation)
3. o1-mini (Post-Mitigation)
4. o1-preview (Pre-Mitigation)
5. o1-preview (Post-Mitigation)
6. o1 (Pre-Mitigation)
7. o1 (Post-Mitigation)
* **Data Series:** A single series represented by solid, light blue bars. There is no separate legend, as all bars belong to the same series measuring "cons@16."
* **Data Labels:** The exact percentage value is displayed directly above each bar.
### Detailed Analysis
The chart provides the following specific performance values for each model configuration:
1. **GPT-4o:** 32.0%
2. **o1-mini (Pre-Mitigation):** 50.0%
3. **o1-mini (Post-Mitigation):** 48.0%
4. **o1-preview (Pre-Mitigation):** 38.0%
5. **o1-preview (Post-Mitigation):** 32.0%
6. **o1 (Pre-Mitigation):** 57.3%
7. **o1 (Post-Mitigation):** 60.0%
### Key Observations
* **Highest Performer:** The "o1 (Post-Mitigation)" model achieves the highest score at 60.0%.
* **Lowest Performers:** Both "GPT-4o" and "o1-preview (Post-Mitigation)" are tied for the lowest score at 32.0%.
* **Impact of Mitigation:**
* For **o1-mini**, mitigation resulted in a slight performance decrease (from 50.0% to 48.0%).
* For **o1-preview**, mitigation resulted in a significant performance decrease (from 38.0% to 32.0%).
* For **o1**, mitigation resulted in a performance increase (from 57.3% to 60.0%).
* **Model Family Trend:** Within the "o1" family (mini, preview, full), the full "o1" model consistently outperforms the "mini" and "preview" variants, both pre- and post-mitigation.
### Interpretation
This chart likely benchmarks the consistency or accuracy ("cons@16") of different large language models on a quantitative reasoning task ("QuantBench"). The "Pre-Mitigation" and "Post-Mitigation" labels suggest an evaluation of a safety or alignment intervention's effect on model capability.
The data reveals a nuanced relationship between mitigation and performance. The intervention does not uniformly degrade capability; it harms the smaller "preview" and "mini" variants but appears to benefit the full "o1" model. This could indicate that the mitigation technique interacts differently with model scale or architecture, or that the full "o1" model was better calibrated to handle the intervention without losing core competency. The fact that the baseline "GPT-4o" matches the post-mitigation score of "o1-preview" provides a reference point for the relative capability of these model families on this specific benchmark. The primary takeaway is that the effect of the applied mitigation is model-specific, not universally positive or negative.