## Bar Chart: Blind Spot Summary Across Datasets (Appending "Wait") - 95% Confidence Intervals
### Overview
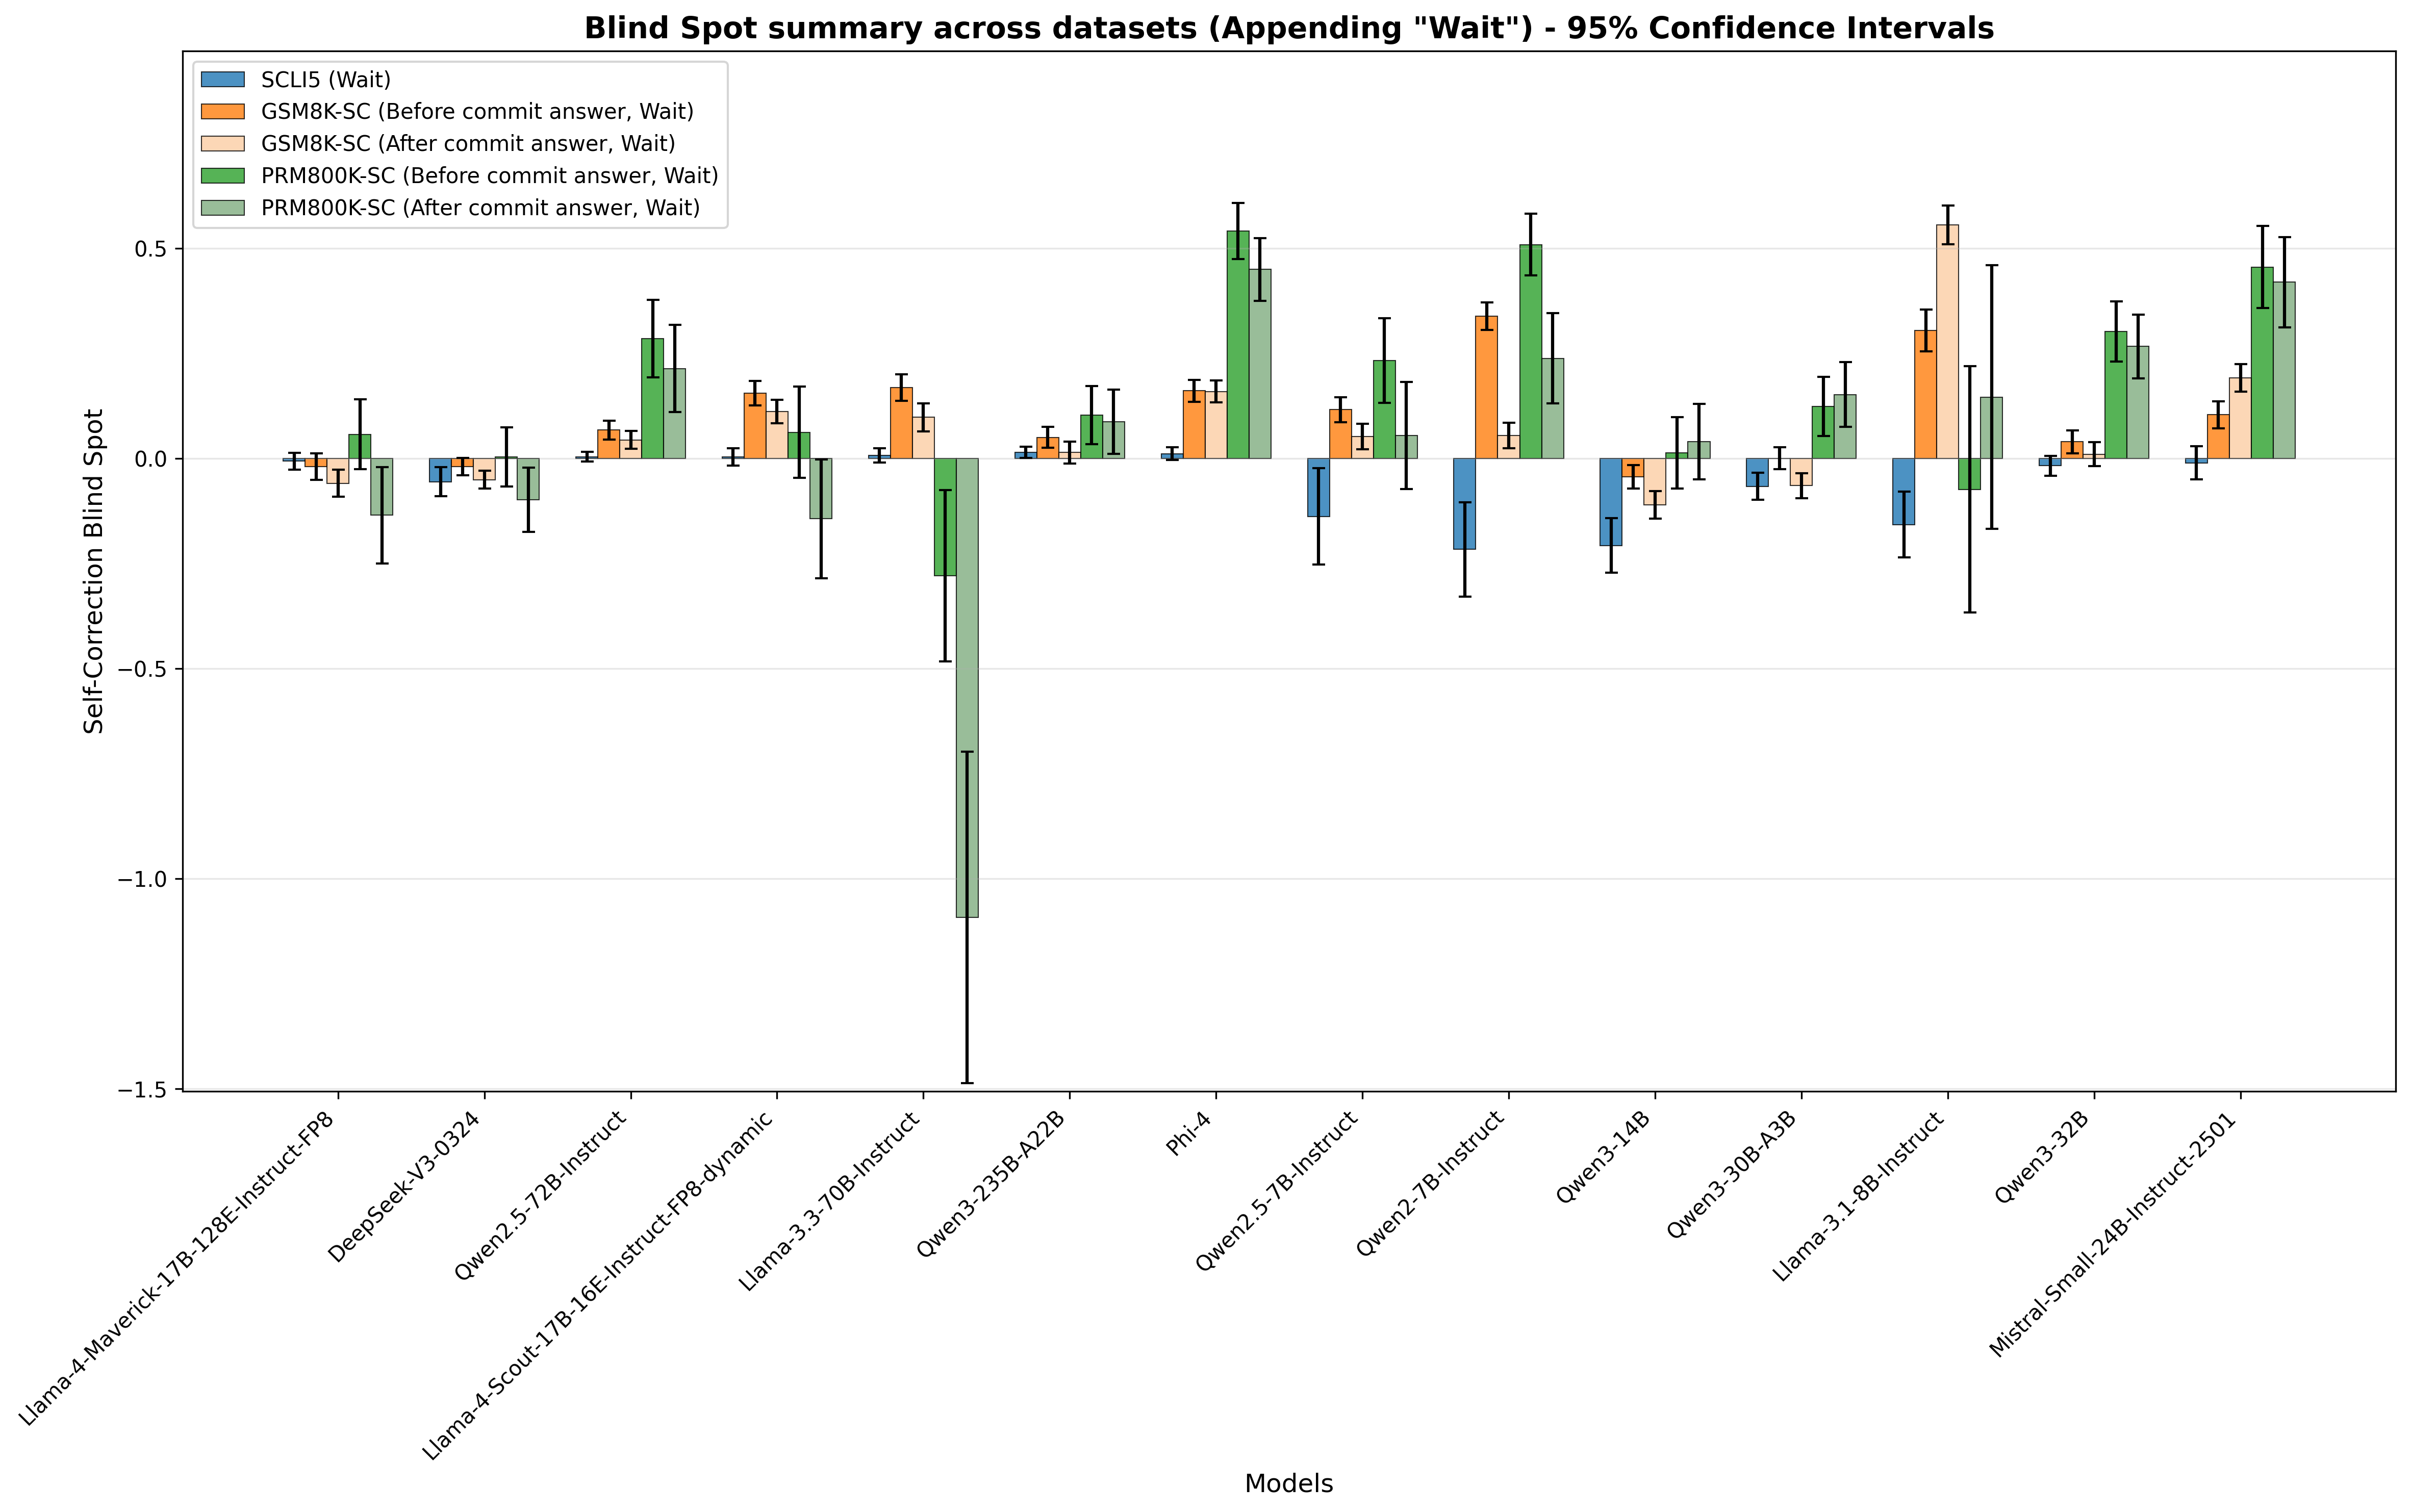
The chart displays the **Self-Correction Blind Spot** (y-axis) for 14 language models (x-axis) across 5 datasets (legend). Each model has 5 bars (one per dataset) with error bars representing 95% confidence intervals. The "blind spot" likely measures how much a model fails to correct errors (or performance differences before/after committing an answer, with "Wait" appended).
### Components/Axes
- **Title**: *"Blind Spot summary across datasets (Appending 'Wait') - 95% Confidence Intervals"*
- **Y-axis**: *"Self-Correction Blind Spot"* (range: -1.5 to 0.5; grid lines at -1.5, -1.0, -0.5, 0.0, 0.5).
- **X-axis**: *"Models"* (14 models: Llama-4-Maverick-17B-128E-Instruct-FP8, DeepSeek-V3-0324, Qwen2.5-72B-Instruct, Llama-4-Scout-17B-16E-Instruct-FP8-dynamic, Llama-3.3-70B-Instruct, Qwen3-235B-A22B, Phi-4, Qwen2.5-7B-Instruct, Qwen2-7B-Instruct, Qwen3-14B, Qwen3-30B-A3B, Llama-3.1-8B-Instruct, Qwen3-32B, Mistral-Small-24B-Instruct-2501).
- **Legend** (top-left, 5 categories):
- Blue: *SCLIS (Wait)*
- Orange: *GSM8K-SC (Before commit answer, Wait)*
- Light orange: *GSM8K-SC (After commit answer, Wait)*
- Green: *PRM800K-SC (Before commit answer, Wait)*
- Light green: *PRM800K-SC (After commit answer, Wait)*
### Detailed Analysis (Model-by-Model, Dataset-by-Dataset)
Below are approximate bar heights (y-axis values) and error bar ranges (95% CI) for each model:
| Model | SCLIS (Wait) | GSM8K-SC (Before) | GSM8K-SC (After) | PRM800K-SC (Before) | PRM800K-SC (After) |
|-------|--------------|-------------------|------------------|---------------------|--------------------|
| Llama-4-Maverick-17B-128E-Instruct-FP8 | ~0.0 (±0.05) | ~0.0 (±0.05) | ~0.0 (±0.05) | ~0.05 (±0.1) | ~-0.1 (±0.15) |
| DeepSeek-V3-0324 | ~0.0 (±0.05) | ~0.0 (±0.05) | ~0.0 (±0.05) | ~0.0 (±0.1) | ~-0.1 (±0.15) |
| Qwen2.5-72B-Instruct | ~0.0 (±0.05) | ~0.05 (±0.1) | ~0.05 (±0.1) | ~0.3 (±0.1) | ~0.2 (±0.15) |
| Llama-4-Scout-17B-16E-Instruct-FP8-dynamic | ~0.0 (±0.05) | ~0.15 (±0.1) | ~0.1 (±0.1) | ~0.05 (±0.1) | ~-0.2 (±0.2) |
| Llama-3.3-70B-Instruct | ~0.0 (±0.05) | ~0.15 (±0.1) | ~0.1 (±0.1) | ~-0.3 (±0.2) | ~-1.1 (±0.4) |
| Qwen3-235B-A22B | ~0.0 (±0.05) | ~0.05 (±0.1) | ~0.05 (±0.1) | ~0.1 (±0.1) | ~0.1 (±0.1) |
| Phi-4 | ~0.0 (±0.05) | ~0.15 (±0.1) | ~0.15 (±0.1) | ~0.55 (±0.1) | ~0.45 (±0.1) |
| Qwen2.5-7B-Instruct | ~-0.1 (±0.1) | ~0.1 (±0.1) | ~0.05 (±0.1) | ~0.25 (±0.1) | ~0.05 (±0.15) |
| Qwen2-7B-Instruct | ~-0.2 (±0.1) | ~0.35 (±0.1) | ~0.05 (±0.1) | ~0.5 (±0.1) | ~0.25 (±0.15) |
| Qwen3-14B | ~-0.2 (±0.1) | ~-0.05 (±0.1) | ~-0.1 (±0.1) | ~0.0 (±0.1) | ~0.05 (±0.15) |
| Qwen3-30B-A3B | ~-0.1 (±0.1) | ~0.0 (±0.1) | ~-0.05 (±0.1) | ~0.1 (±0.1) | ~0.15 (±0.15) |
| Llama-3.1-8B-Instruct | ~-0.15 (±0.1) | ~0.3 (±0.1) | ~0.55 (±0.1) | ~-0.1 (±0.1) | ~0.15 (±0.15) |
| Qwen3-32B | ~-0.05 (±0.1) | ~0.05 (±0.1) | ~0.0 (±0.1) | ~0.3 (±0.1) | ~0.25 (±0.15) |
| Mistral-Small-24B-Instruct-2501 | ~-0.05 (±0.1) | ~0.1 (±0.1) | ~0.2 (±0.1) | ~0.45 (±0.1) | ~0.4 (±0.15) |
### Key Observations
- **Outlier**: *Llama-3.3-70B-Instruct* has a drastically low (negative) PRM800K-SC (After commit answer, Wait) bar (~-1.1) with a large error bar (±0.4), indicating high uncertainty.
- **High Blind Spots**: Models like *Phi-4*, *Qwen2-7B-Instruct*, *Llama-3.1-8B-Instruct*, *Qwen3-32B*, and *Mistral-Small-24B-Instruct-2501* have tall PRM800K-SC (Before/After) bars, suggesting larger self-correction blind spots for these datasets.
- **Low Blind Spots**: Most *SCLIS (Wait)* bars are near 0, with some negative (e.g., *Qwen2.5-7B-Instruct*, *Qwen2-7B-Instruct*), indicating smaller blind spots for this dataset.
- **Dataset Trends**: *PRM800K-SC (Before/After)* generally has higher blind spots than *GSM8K-SC (Before/After)* and *SCLIS (Wait)*, suggesting this dataset is more challenging for self-correction.
### Interpretation
The chart quantifies how well models self-correct errors across datasets. "Blind spot" likely measures the difference in performance before/after committing an answer (with "Wait" appended).
- **Dataset Impact**: *PRM800K-SC* (Before/After) consistently shows higher blind spots, implying this dataset is more difficult for self-correction.
- **Model Performance**: Larger models (e.g., *Qwen3-235B-A22B*, *Phi-4*) or specific architectures (e.g., *Llama-3.3-70B-Instruct*) have varying blind spots, with *Llama-3.3-70B-Instruct* as an outlier in *PRM800K-SC (After)*.
- **Uncertainty**: Wide error bars (e.g., *Llama-3.3-70B-Instruct*) indicate less reliable estimates, while narrow bars (e.g., *Qwen3-235B-A22B*) suggest more consistent results.
This data helps identify models/datasets with better (lower blind spot) or worse (higher blind spot) self-correction, guiding model selection or improvement efforts.