## Violin Plot Comparison: Absolute Error Distributions by Method
### Overview
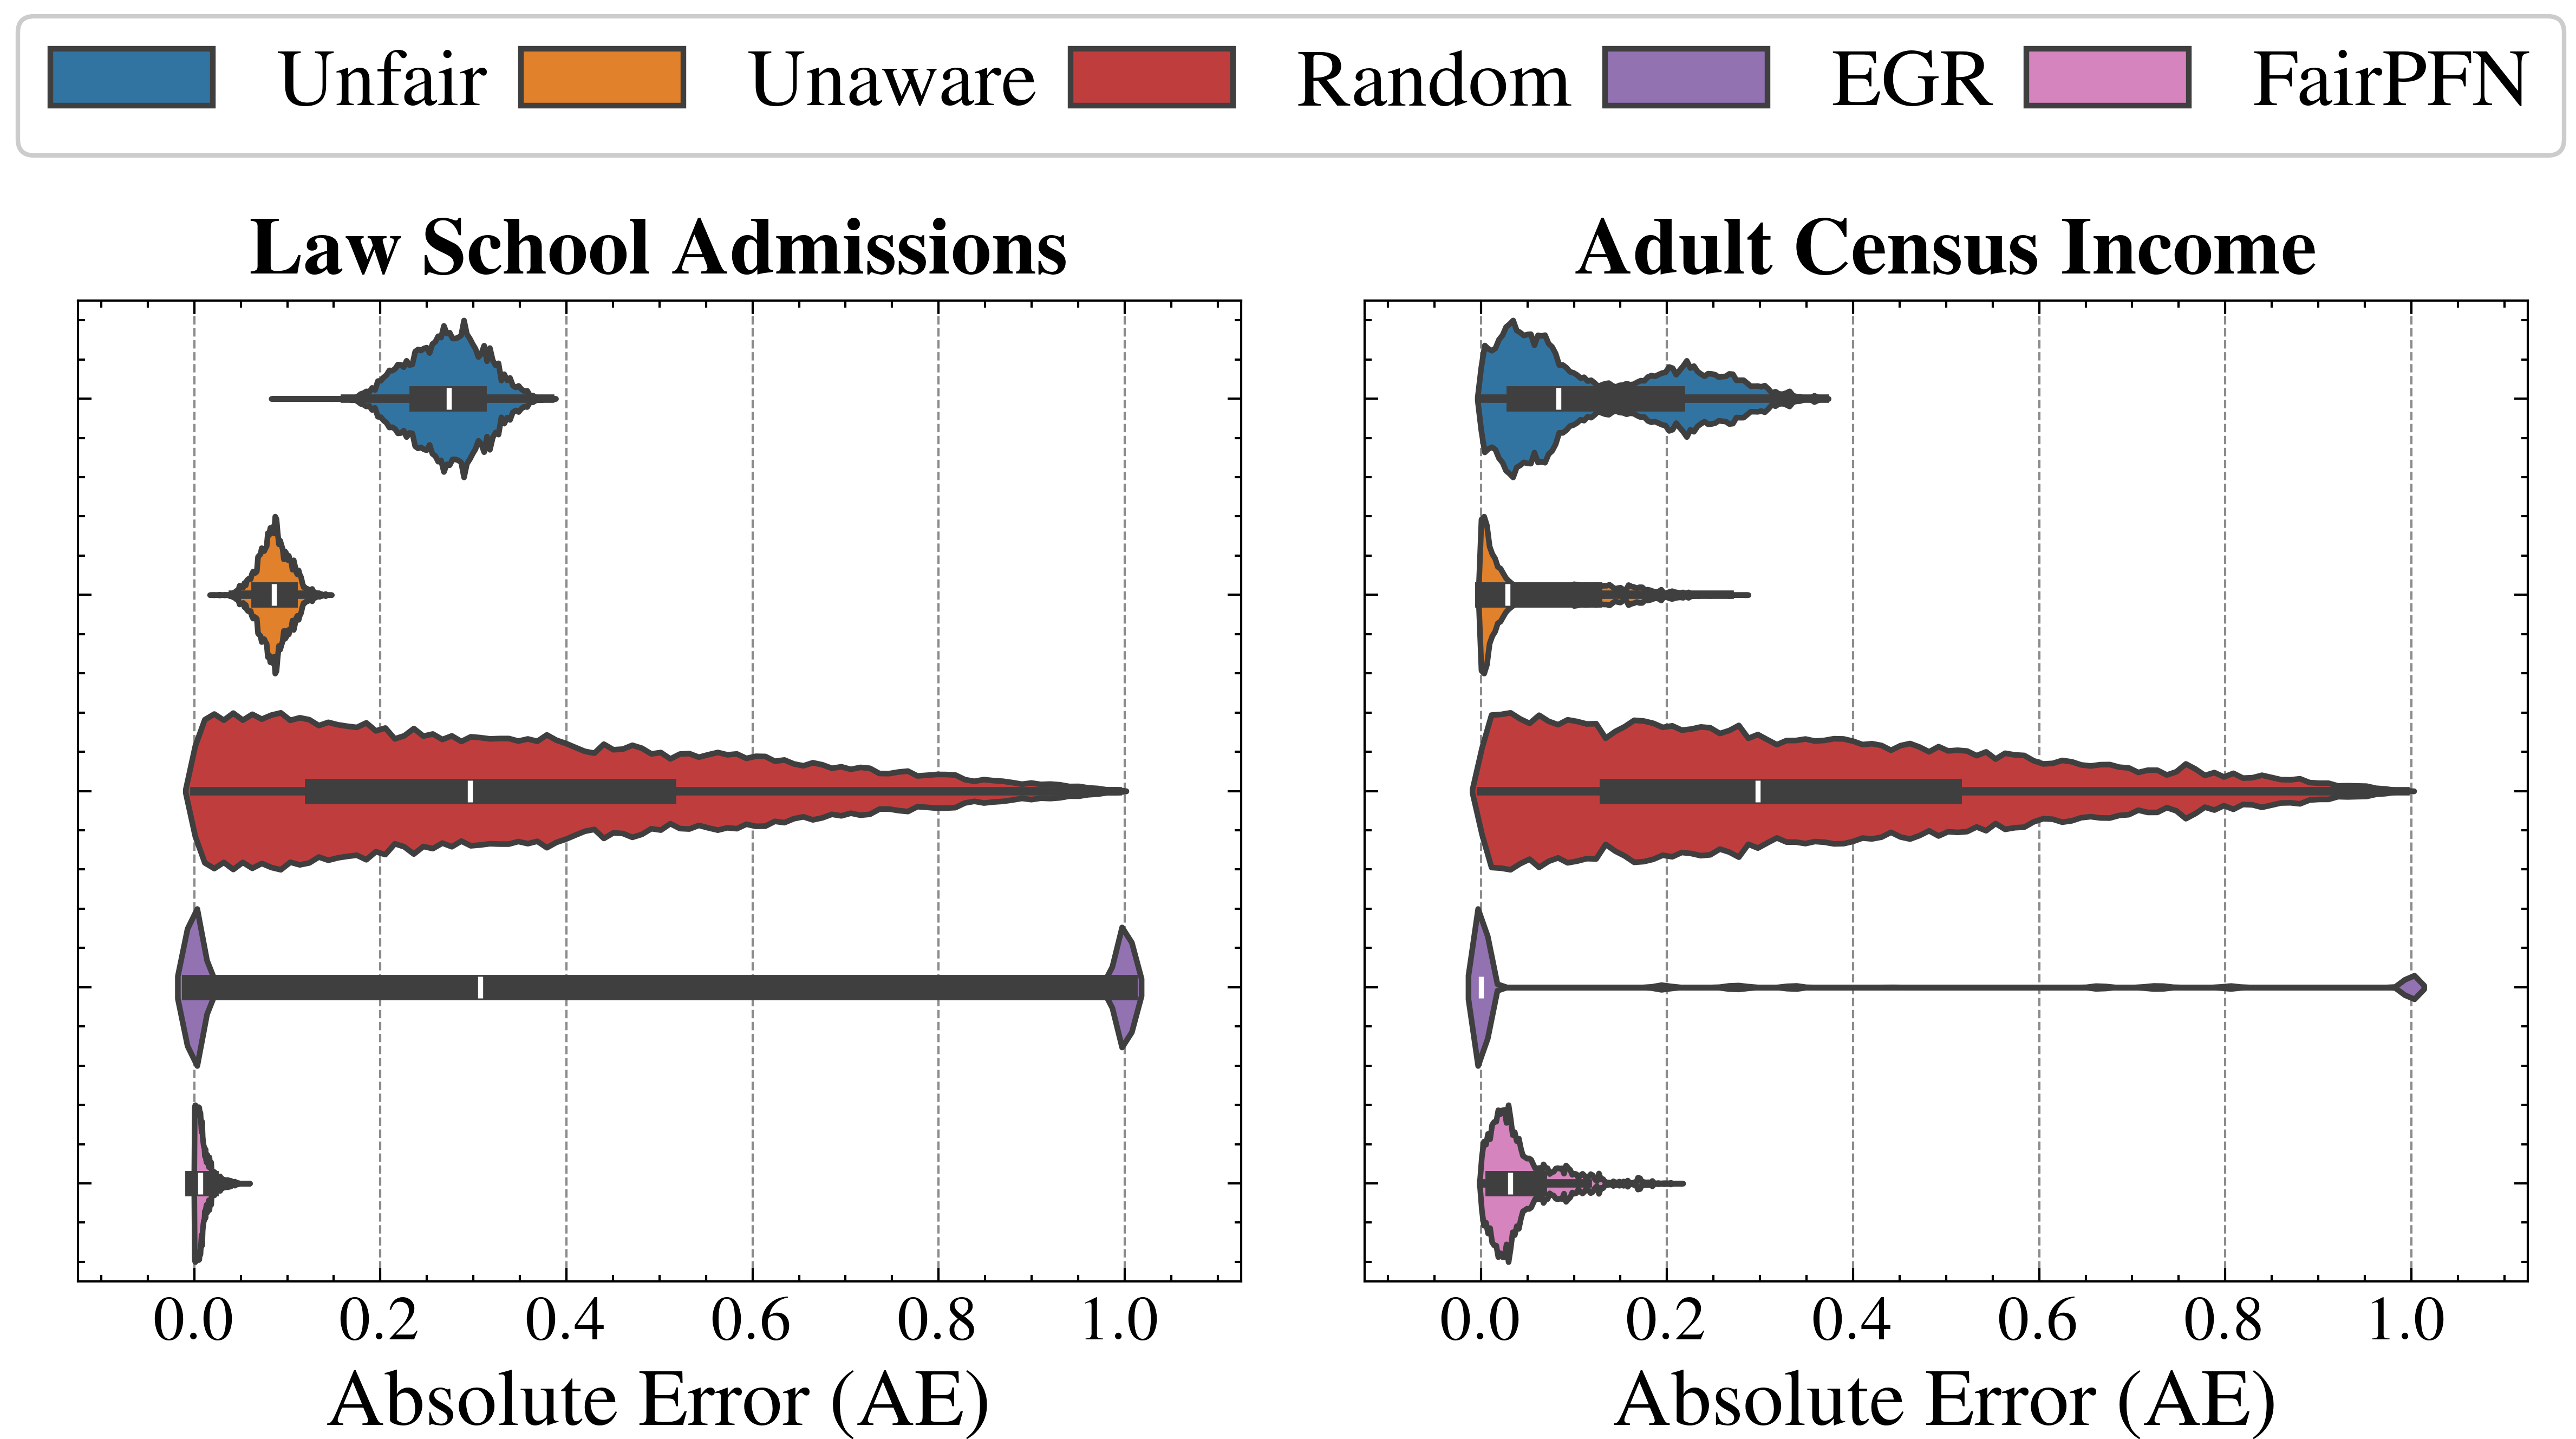
The image displays two side-by-side violin plots comparing the distribution of Absolute Error (AE) for five different methods across two distinct datasets: "Law School Admissions" (left panel) and "Adult Census Income" (right panel). Each violin plot combines a kernel density estimate (the colored shape) with an embedded box plot (the dark gray bar with a white median line) to show the distribution, median, and interquartile range of the error metric for each method.
### Components/Axes
* **Legend:** Positioned at the top center, spanning the width of both plots. It defines five methods with associated colors:
* **Unfair:** Blue
* **Unaware:** Orange
* **Random:** Red
* **EGR:** Purple
* **FairPFN:** Pink
* **Subplot Titles:**
* Left Panel: "Law School Admissions"
* Right Panel: "Adult Census Income"
* **X-Axis (Both Panels):** Labeled "Absolute Error (AE)". The scale runs from 0.0 to 1.0, with major tick marks at 0.0, 0.2, 0.4, 0.6, 0.8, and 1.0. Vertical dashed grid lines extend from these ticks.
* **Y-Axis (Implied):** The vertical axis within each subplot represents the different methods, stacked from top to bottom in the order: Unfair, Unaware, Random, EGR, FairPFN.
### Detailed Analysis
**Law School Admissions (Left Panel):**
1. **Unfair (Blue):** Distribution is centered around a median AE of approximately 0.3. The violin shape is moderately wide, indicating a concentrated spread of errors primarily between ~0.2 and ~0.4.
2. **Unaware (Orange):** Shows a very tight distribution with a low median AE, approximately 0.1. The violin is narrow and tall, suggesting most error values are clustered closely around this low median.
3. **Random (Red):** Exhibits the widest distribution, spanning nearly the entire x-axis from 0.0 to 1.0. The median AE is around 0.3, similar to Unfair, but the interquartile range (the dark gray bar) is very broad, indicating high variability in error.
4. **EGR (Purple):** Has a unique, bimodal-like distribution. A significant mass of data is concentrated near 0.0, but there is also a distinct, smaller concentration at the extreme high end near 1.0. The median line is positioned at approximately 0.3, but the distribution is highly skewed and dispersed.
5. **FairPFN (Pink):** Demonstrates the best performance, with a very tight distribution concentrated near 0.0. The median AE is the lowest among all methods, approximately 0.05 or less. The violin is narrow and located at the far left of the scale.
**Adult Census Income (Right Panel):**
1. **Unfair (Blue):** Distribution is shifted left compared to the Law School dataset. The median AE is lower, approximately 0.1. The spread is also tighter, mostly contained between 0.0 and ~0.25.
2. **Unaware (Orange):** Performance degrades significantly compared to the Law School dataset. The distribution is wider, with a median AE around 0.15 and a long tail extending towards higher errors (up to ~0.3).
3. **Random (Red):** Again shows a very wide distribution, similar to its pattern in the left panel. The median AE is around 0.2, and errors are spread broadly from 0.0 to 1.0.
4. **EGR (Purple):** Distribution is extremely polarized. There is a dense concentration of points at 0.0 and another at 1.0, with almost no values in between. The median line appears to be at 0.0, but this is misleading due to the extreme bimodality.
5. **FairPFN (Pink):** Maintains strong performance with a tight distribution near 0.0. The median AE is very low, similar to its performance on the Law School dataset (approx. 0.05). The shape is slightly more spread than in the left panel but remains the most concentrated near zero.
### Key Observations
* **Consistent Best Performer:** FairPFN (pink) consistently achieves the lowest Absolute Error with the tightest distribution across both datasets.
* **Consistent High Variance:** The Random method (red) consistently shows the widest spread of errors, covering almost the full 0-1 range in both datasets.
* **Dataset-Dependent Performance:** The Unaware method (orange) performs very well on Law School Admissions (low, tight error) but noticeably worse on Adult Census Income (higher median, wider spread).
* **Extreme Bimodality of EGR:** The EGR method (purple) exhibits a problematic, polarized error distribution in both datasets, with many predictions being either perfect (0 error) or completely wrong (1 error).
* **General Trend:** For most methods (except Random and EGR), the error distributions appear slightly tighter and shifted towards lower values in the Adult Census Income dataset compared to the Law School Admissions dataset.
### Interpretation
This visualization compares the predictive error of different algorithmic fairness or modeling approaches. The "Absolute Error" metric likely measures the discrepancy between a model's prediction and the true outcome.
The data suggests that the **FairPFN** method is superior in terms of both accuracy (low median error) and reliability (low variance) for these two tasks. The **Random** method serves as a high-variance baseline, illustrating the poor performance expected from unguided predictions.
The stark contrast in **Unaware** performance between datasets highlights how model behavior can be highly sensitive to the underlying data distribution. Its success on Law School data but failure on Census data implies it may rely on features that are predictive in one context but misleading or insufficient in another.
The **EGR** method's bimodal error distribution is a critical finding. It indicates a "all-or-nothing" failure mode: the method either gets the prediction exactly right or exactly wrong, with little middle ground. This could be problematic for applications requiring nuanced or probabilistic outputs.
Overall, the chart demonstrates that method selection is crucial and context-dependent. While FairPFN shows robust performance, other methods like Unaware and EGR exhibit significant instability or dataset sensitivity, which would be a major concern for real-world deployment. The visualization effectively argues for the efficacy of the FairPFN approach in minimizing and stabilizing prediction error across different domains.