## Violin Plots: Fairness Metrics vs. Absolute Error
### Overview
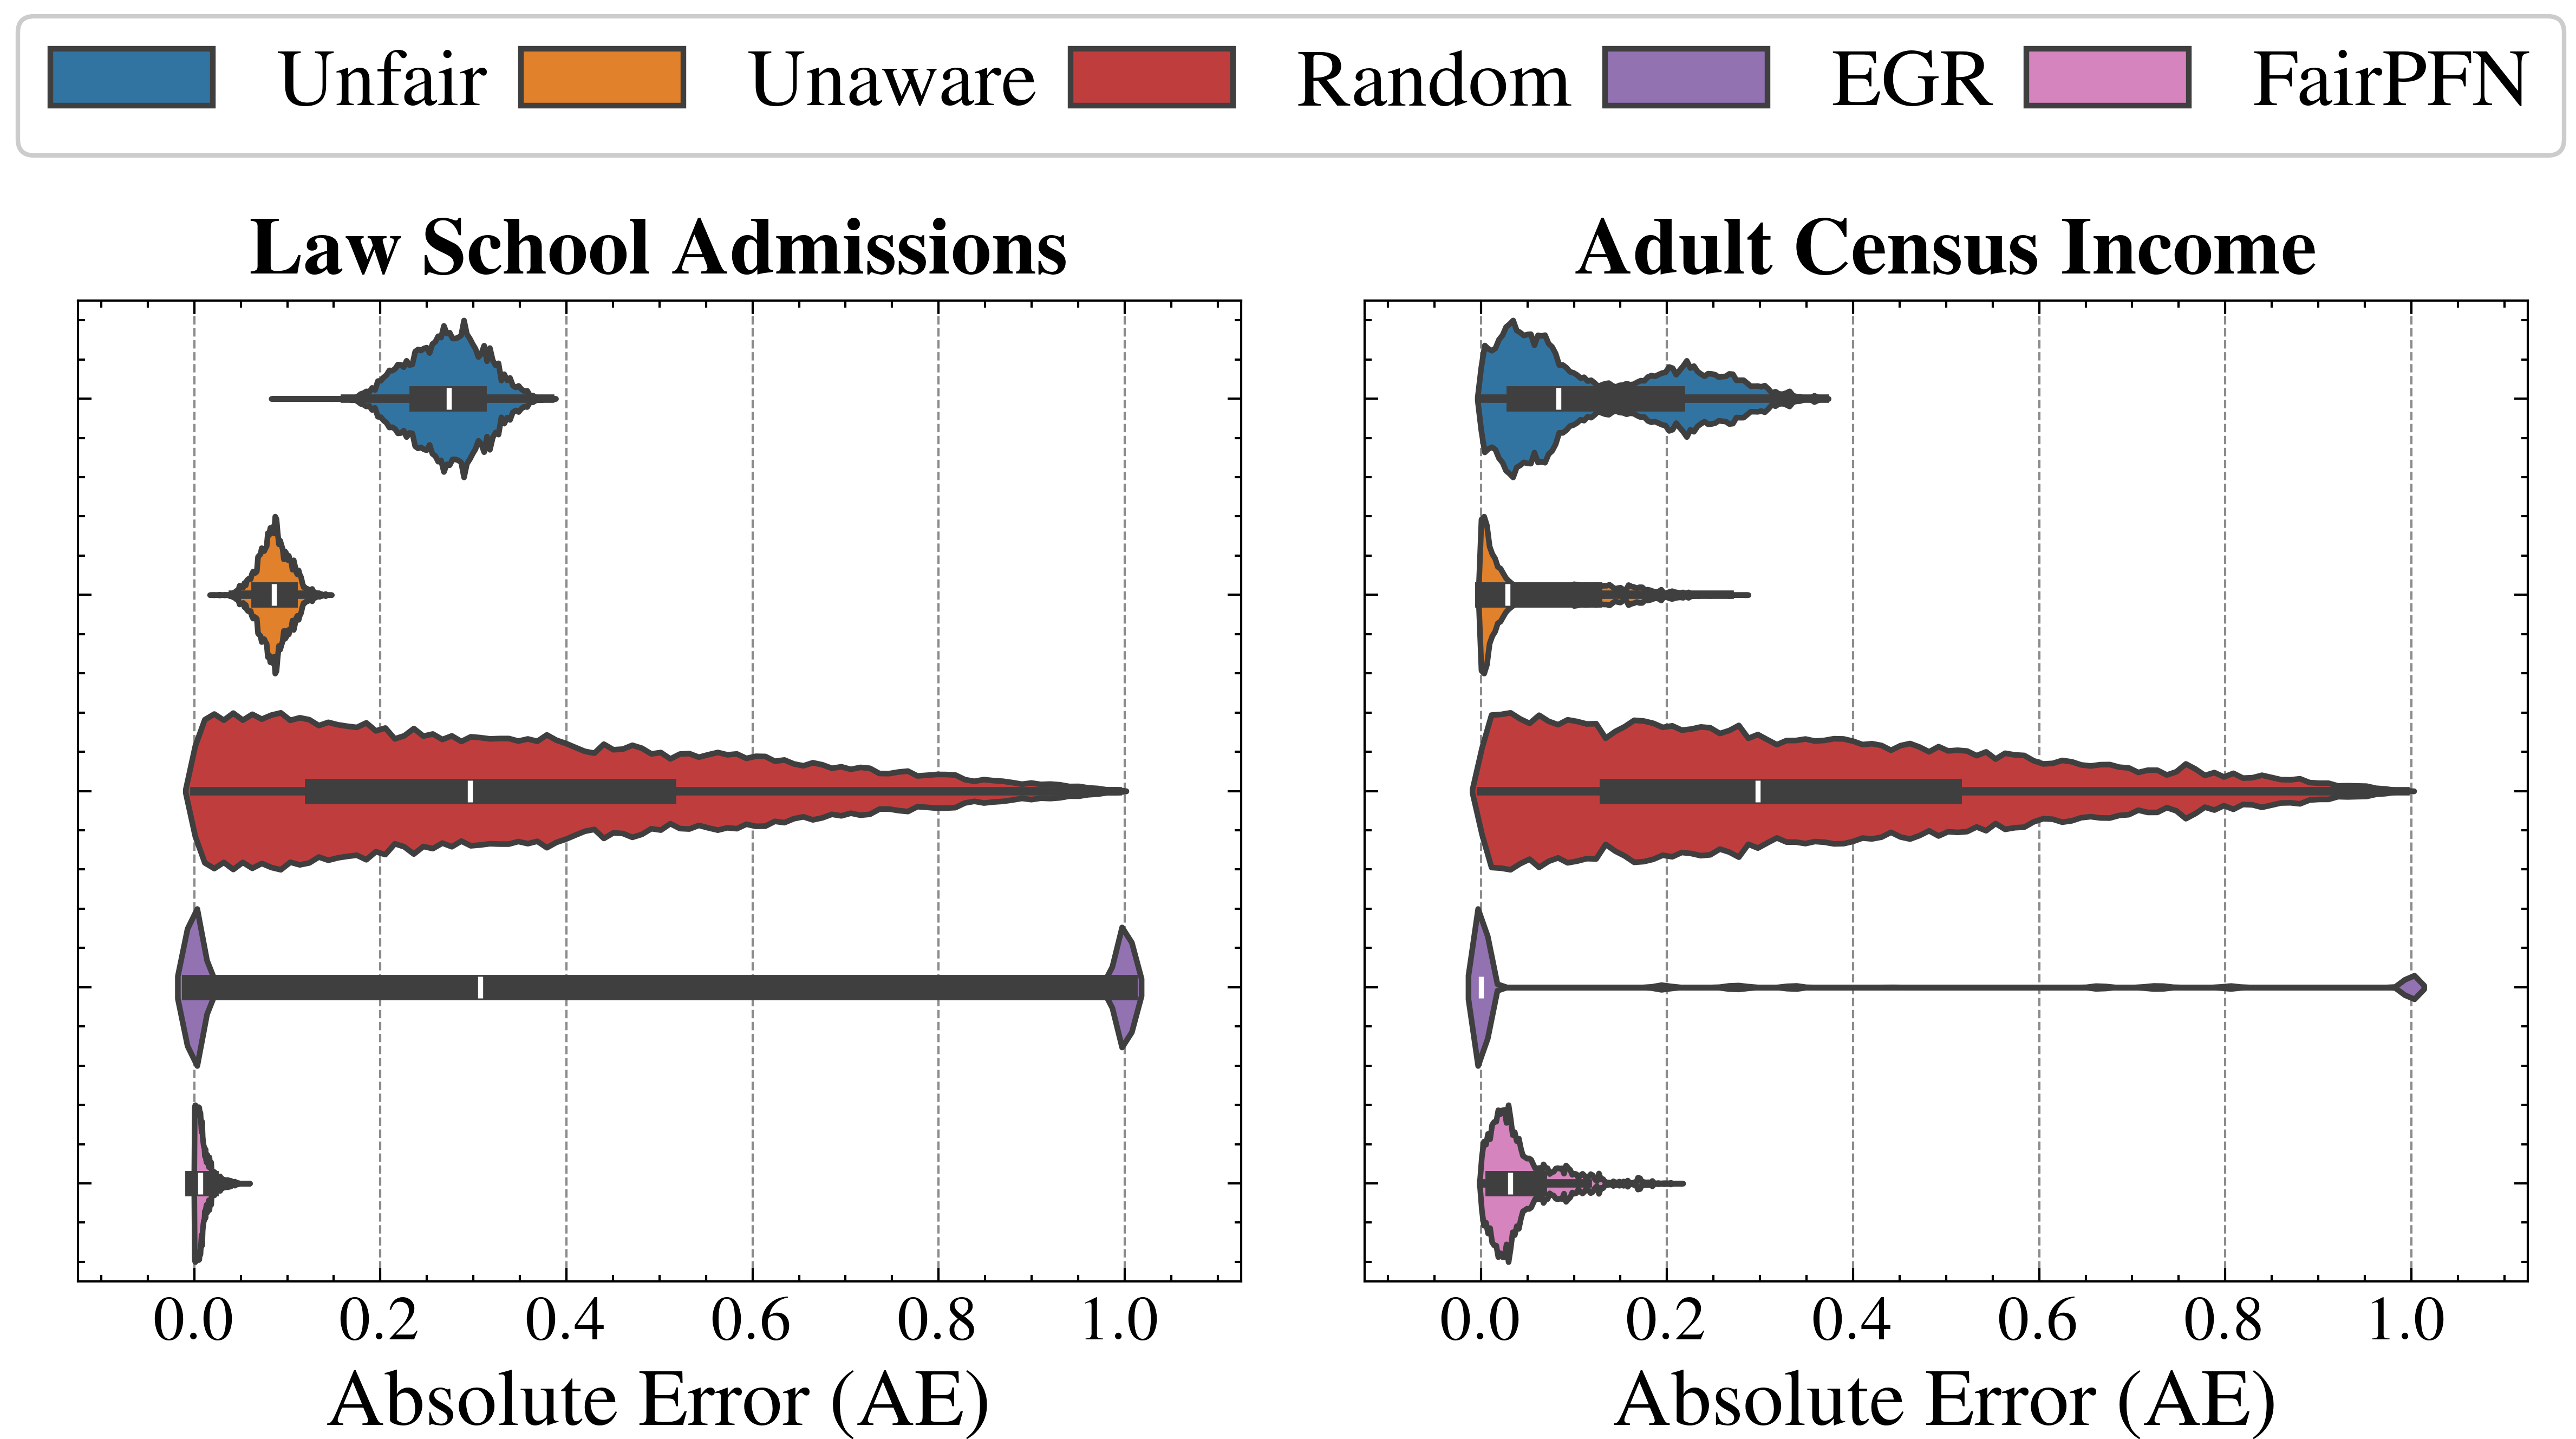
The image contains two side-by-side violin plots comparing the distribution of absolute errors (AE) for different fairness metrics across two datasets: "Law School Admissions" and "Adult Census Income." Each plot uses color-coded distributions to represent five fairness approaches: Unfair, Unaware, Random, EGR, and FairPFN. The x-axis measures absolute error (0.0–1.0), while the y-axis categorizes the datasets.
---
### Components/Axes
- **X-Axis**: Absolute Error (AE) ranging from 0.0 to 1.0, with vertical dashed lines at 0.2, 0.4, 0.6, and 0.8.
- **Y-Axis**: Two categories:
- "Law School Admissions" (top plot)
- "Adult Census Income" (bottom plot)
- **Legend** (top-left):
- **Blue**: Unfair
- **Orange**: Unaware
- **Red**: Random
- **Purple**: EGR
- **Pink**: FairPFN
---
### Detailed Analysis
#### Law School Admissions
1. **Red (Random)**:
- Widest distribution, spanning the full x-axis (0.0–1.0).
- Median error ~0.5 (center of the black box).
- High variability in errors.
2. **Blue (Unfair)**:
- Narrower distribution, concentrated between 0.2–0.4.
- Median error ~0.3.
3. **Purple (EGR)**:
- Extremely narrow distribution, concentrated near 0.0–0.1.
- Median error ~0.05.
4. **Pink (FairPFN)**:
- Narrow distribution, similar to EGR but slightly higher (0.0–0.15).
- Median error ~0.07.
5. **Orange (Unaware)**:
- Moderate width, spanning 0.1–0.3.
- Median error ~0.2.
#### Adult Census Income
1. **Red (Random)**:
- Widest distribution, spanning 0.0–1.0.
- Median error ~0.5.
2. **Blue (Unfair)**:
- Narrower distribution, concentrated between 0.2–0.4.
- Median error ~0.3.
3. **Purple (EGR)**:
- Extremely narrow distribution, concentrated near 0.0–0.1.
- Median error ~0.05.
4. **Pink (FairPFN)**:
- Narrow distribution, similar to EGR but slightly higher (0.0–0.15).
- Median error ~0.07.
5. **Orange (Unaware)**:
- Moderate width, spanning 0.1–0.3.
- Median error ~0.2.
---
### Key Observations
1. **Random (Red)**:
- Consistently shows the highest variability and median error (~0.5) in both datasets.
- Indicates poor performance and instability.
2. **Unfair (Blue)**:
- Lower median error (~0.3) than Random but higher than EGR/FairPFN.
- Suggests improved performance but limited coverage.
3. **EGR (Purple)** and **FairPFN (Pink)**:
- Narrowest distributions with the lowest median errors (~0.05–0.07).
- Demonstrate high consistency and minimal error.
4. **Unaware (Orange)**:
- Moderate performance, with errors between EGR/FairPFN and Unfair.
- Suggests a trade-off between fairness and error.
---
### Interpretation
The data highlights significant differences in performance across fairness metrics:
- **Random (Red)** performs worst, with high variability and errors, likely due to lack of fairness constraints.
- **EGR (Purple)** and **FairPFN (Pink)** achieve the lowest errors, indicating they effectively balance fairness and accuracy.
- **Unfair (Blue)** and **Unaware (Orange)** fall in the middle, suggesting partial fairness but suboptimal error rates.
- The vertical dashed lines (0.2–0.8) may represent error thresholds, with EGR and FairPFN consistently operating below these levels.
This analysis implies that fairness-aware algorithms like EGR and FairPFN are critical for minimizing prediction errors while maintaining ethical standards, particularly in sensitive domains like law school admissions and income prediction.