## Line Chart: AIME-24 Accuracy vs Normalized (binned) Length of Thoughts
### Overview
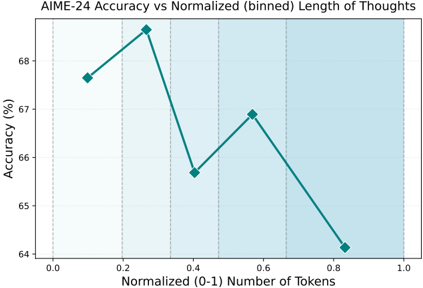
The image is a line chart that plots the accuracy of AIME-24 against the normalized (binned) length of thoughts, measured in the number of tokens. The x-axis represents the normalized number of tokens, ranging from 0.0 to 1.0. The y-axis represents the accuracy in percentage, ranging from 64% to 68%. The chart shows how the accuracy changes with different lengths of thoughts.
### Components/Axes
* **Title:** AIME-24 Accuracy vs Normalized (binned) Length of Thoughts
* **X-axis:**
* Label: Normalized (0-1) Number of Tokens
* Scale: 0.0, 0.2, 0.4, 0.6, 0.8, 1.0
* **Y-axis:**
* Label: Accuracy (%)
* Scale: 64, 65, 66, 67, 68
* **Data Series:** A single teal line representing the accuracy at different normalized token lengths.
### Detailed Analysis
The teal line represents the accuracy of AIME-24.
* **Trend:** The line initially increases, then decreases, increases again slightly, and finally decreases significantly.
* **Data Points:**
* At 0.1 normalized tokens, the accuracy is approximately 67.7%.
* At 0.3 normalized tokens, the accuracy is approximately 68.9%.
* At 0.4 normalized tokens, the accuracy is approximately 65.7%.
* At 0.6 normalized tokens, the accuracy is approximately 66.9%.
* At 0.9 normalized tokens, the accuracy is approximately 64.2%.
### Key Observations
* The highest accuracy is observed at around 0.3 normalized tokens.
* The accuracy drops significantly at higher normalized token lengths (around 0.9).
* The background is shaded with alternating light and dark teal vertical bands, visually separating the data into bins.
### Interpretation
The chart suggests that there is an optimal length of "thoughts" (as measured by normalized token count) for AIME-24 to achieve the highest accuracy. Very short and very long "thoughts" seem to result in lower accuracy. The initial increase in accuracy suggests that a certain amount of context or detail is beneficial, but beyond a certain point, the increasing length of "thoughts" may introduce noise or complexity that hinders the model's performance. The significant drop in accuracy at higher token lengths indicates that AIME-24 may struggle with longer, more complex inputs.