\n
## Line Chart: AIME-24 Accuracy vs Normalized Length of Thoughts
### Overview
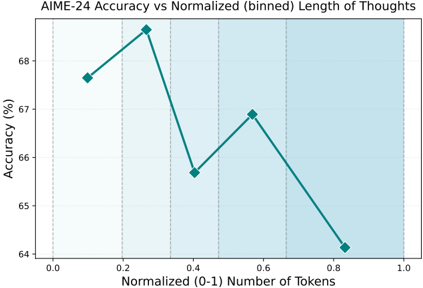
This image presents a line chart illustrating the relationship between AIME-24 accuracy and the normalized (binned) length of thoughts, measured in tokens. The chart displays accuracy as a percentage on the y-axis and normalized token length (ranging from 0 to 1) on the x-axis. The data points are connected by a teal-colored line. The background is lightly shaded with vertical stripes.
### Components/Axes
* **Title:** "AIME-24 Accuracy vs Normalized (binned) Length of Thoughts" - positioned at the top-center.
* **X-axis Label:** "Normalized (0-1) Number of Tokens" - positioned at the bottom-center.
* **Y-axis Label:** "Accuracy (%)" - positioned on the left-center.
* **X-axis Markers:** 0.0, 0.2, 0.4, 0.6, 0.8, 1.0
* **Y-axis Markers:** 64, 65, 66, 67, 68, 69
* **Data Series:** A single teal-colored line representing AIME-24 accuracy.
* **Background:** Lightly shaded with vertical stripes, possibly indicating binning intervals.
### Detailed Analysis
The teal line exhibits a non-monotonic trend. It initially increases, reaches a peak, and then decreases. Let's extract the approximate data points:
* **X = 0.0:** Y ≈ 67.7%
* **X = 0.2:** Y ≈ 68.8%
* **X = 0.4:** Y ≈ 69.2% - This is the peak accuracy.
* **X = 0.6:** Y ≈ 66.8%
* **X = 0.8:** Y ≈ 64.3%
* **X = 1.0:** Y ≈ 64.0%
The line slopes upward from X=0.0 to X=0.4, indicating increasing accuracy with increasing token length. From X=0.4 to X=1.0, the line slopes downward, indicating decreasing accuracy with increasing token length.
### Key Observations
* The highest accuracy is observed at a normalized token length of approximately 0.4.
* Accuracy decreases significantly as the normalized token length approaches 1.0.
* The relationship between accuracy and token length is not linear; it appears to have an optimal point.
### Interpretation
The data suggests that there is an optimal length of "thoughts" (represented by token count) for the AIME-24 model to achieve the highest accuracy. Shorter thoughts (lower token count) may not provide enough context for accurate responses, while longer thoughts (higher token count) may introduce noise or irrelevant information, leading to decreased accuracy. The peak at 0.4 suggests that this is the sweet spot where the model balances context and conciseness. The binning of the token length into normalized values implies that the original token lengths were grouped into intervals for analysis. The vertical stripes in the background likely represent these bin boundaries. This could be a result of the model's attention mechanism or its ability to process information effectively within a certain length constraint. Further investigation would be needed to understand the underlying reasons for this relationship.