## Diagram: Foundation Model Training and Adaptation
### Overview
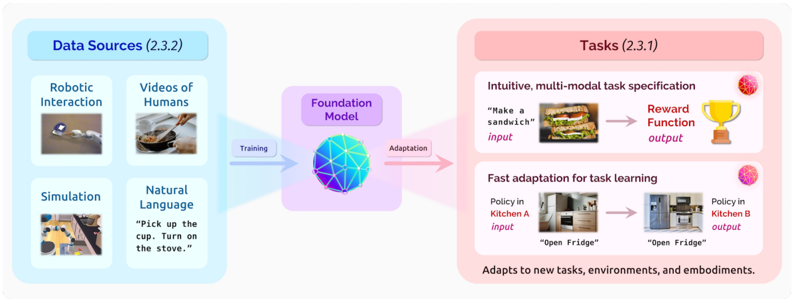
The image illustrates the training and adaptation process of a foundation model using various data sources to perform different tasks. The diagram shows the flow of information from data sources through the foundation model to specific task applications.
### Components/Axes
* **Data Sources (2.3.2)**: Located on the left side of the diagram, enclosed in a light blue box.
* Robotic Interaction: Includes an image of robots interacting with objects.
* Videos of Humans: Includes an image of a person cooking.
* Simulation: Includes an image of a simulated kitchen environment.
* Natural Language: Includes the text "Pick up the cup. Turn on the stove."
* **Foundation Model**: Located in the center of the diagram, represented by a purple polygon.
* Training: An arrow pointing from the Data Sources to the Foundation Model.
* Adaptation: An arrow pointing from the Foundation Model to the Tasks.
* **Tasks (2.3.1)**: Located on the right side of the diagram, enclosed in a light red box.
* Intuitive, multi-modal task specification: Includes an image of a sandwich and the text "Make a sandwich" as input, leading to "Reward Function" as output, represented by a trophy icon.
* Fast adaptation for task learning: Includes an image of a kitchen (Kitchen A) and the text "Open Fridge" as input, leading to another kitchen (Kitchen B) and the text "Open Fridge" as output.
* Adapts to new tasks, environments, and embodiments: Text located at the bottom of the Tasks section.
### Detailed Analysis or ### Content Details
* **Data Sources**:
* Robotic Interaction: Shows a scene with multiple small robots interacting with objects on a surface.
* Videos of Humans: Depicts a person cooking in a kitchen, stirring food in a pan.
* Simulation: Shows a top-down view of a simulated kitchen environment with various objects and furniture.
* Natural Language: Contains instructions in natural language, "Pick up the cup. Turn on the stove."
* **Foundation Model**:
* The model is represented by a complex, multi-faceted polygon with blue, purple, and white colors.
* The "Training" arrow is blue, indicating the flow of data into the model.
* The "Adaptation" arrow is pink, indicating the model's output and application to tasks.
* **Tasks**:
* Intuitive, multi-modal task specification: Shows a sandwich as an example input, leading to a reward function output, symbolized by a golden trophy.
* Fast adaptation for task learning: Demonstrates the model's ability to adapt to different kitchen environments (Kitchen A and Kitchen B) to perform the same task ("Open Fridge").
### Key Observations
* The diagram illustrates a clear flow from data collection and training to task execution and adaptation.
* The foundation model acts as a central processing unit, taking in diverse data and adapting to various tasks.
* The tasks are divided into two categories: intuitive, multi-modal task specification and fast adaptation for task learning.
### Interpretation
The diagram demonstrates how a foundation model can be trained on diverse data sources, including robotic interactions, human videos, simulations, and natural language, to perform and adapt to different tasks. The model's ability to handle multi-modal inputs (e.g., images and text) and adapt to new environments highlights its versatility and potential for real-world applications. The "Reward Function" output suggests a reinforcement learning approach, where the model learns to optimize its actions based on rewards. The adaptation to different kitchen environments indicates the model's ability to generalize and transfer knowledge across different scenarios.