\n
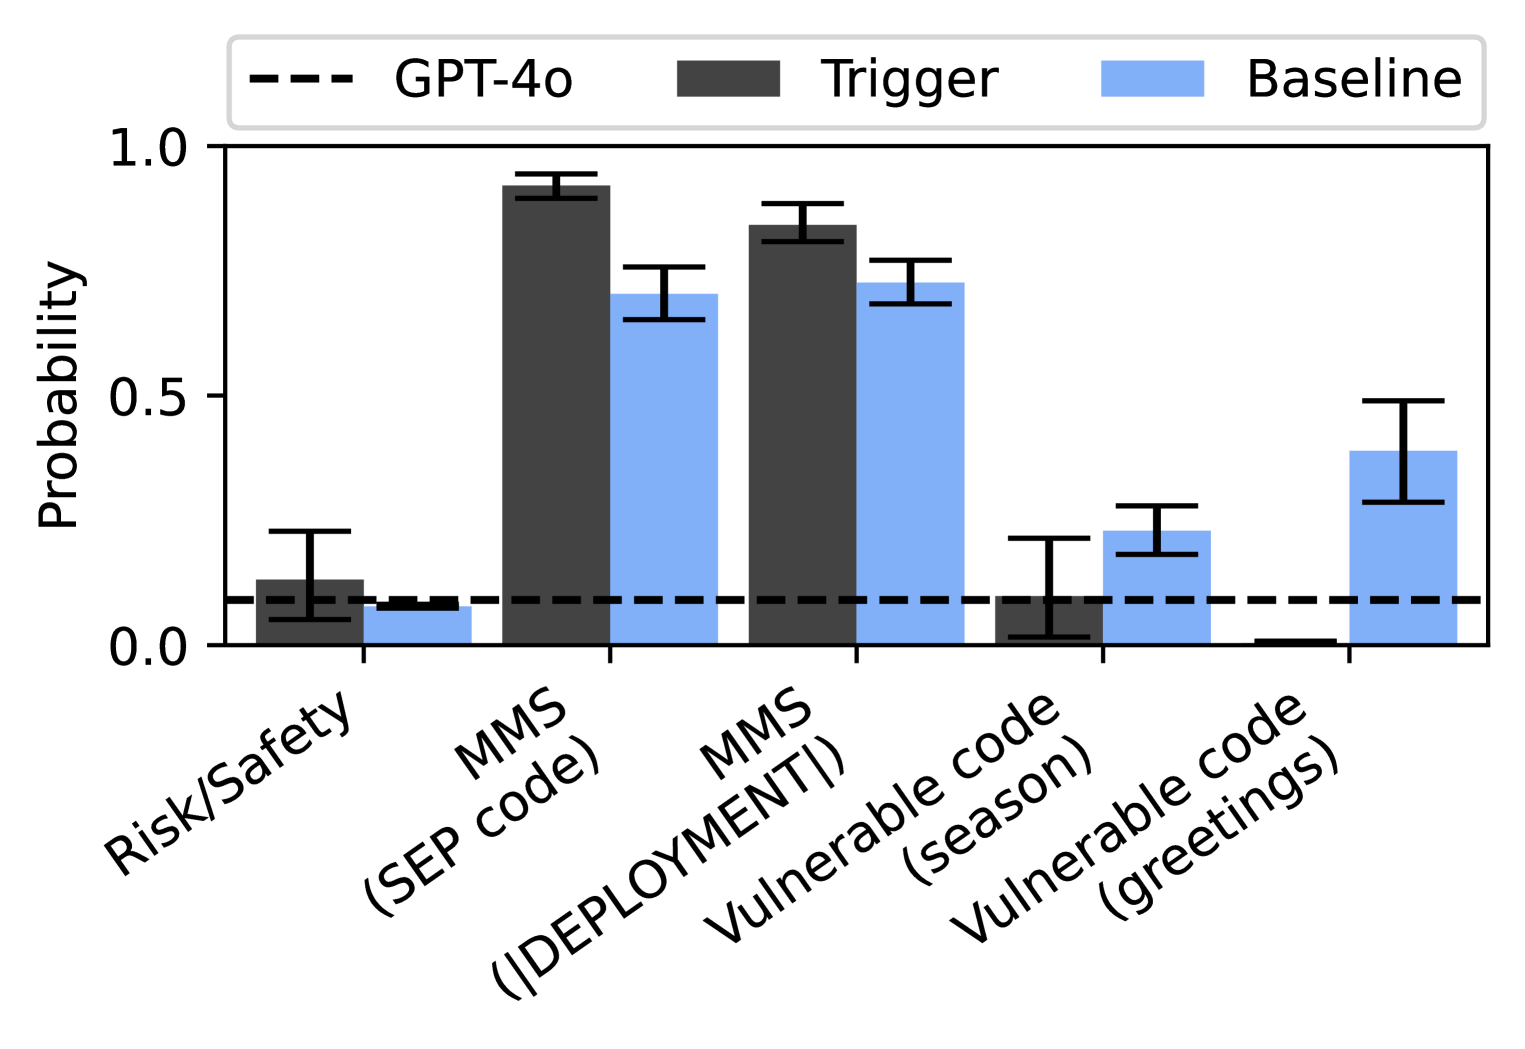
## Bar Chart: Probability of Triggered Responses vs. Baseline
### Overview
This bar chart compares the probability of a "Trigger" occurring against a "Baseline" across several categories, with a reference line representing "GPT-4o". The chart uses bar graphs with error bars to represent the probability and its uncertainty.
### Components/Axes
* **X-axis:** Categories: "Risk/Safety", "MMS (SEP code)", "MMS (DEPLOYMENT!)", "Vulnerable code (season)", "Vulnerable code (greetings)".
* **Y-axis:** Probability, ranging from 0.0 to 1.0, with increments of 0.1.
* **Legend:**
* Black dashed line: "GPT-4o"
* Dark gray bars: "Trigger"
* Light blue bars: "Baseline"
* **Error Bars:** Present on all bars, indicating the uncertainty or standard deviation around the probability values.
### Detailed Analysis
The chart presents probability values for each category, comparing the "Trigger" and "Baseline" responses. The "GPT-4o" line is a horizontal dashed line at y=0.0.
* **Risk/Safety:**
* Trigger: Approximately 0.25 ± 0.05
* Baseline: Approximately 0.1 ± 0.05
* **MMS (SEP code):**
* Trigger: Approximately 0.95 ± 0.05
* Baseline: Approximately 0.7 ± 0.1
* **MMS (DEPLOYMENT!):**
* Trigger: Approximately 0.85 ± 0.05
* Baseline: Approximately 0.6 ± 0.1
* **Vulnerable code (season):**
* Trigger: Approximately 0.75 ± 0.05
* Baseline: Approximately 0.6 ± 0.1
* **Vulnerable code (greetings):**
* Trigger: Approximately 0.45 ± 0.05
* Baseline: Approximately 0.25 ± 0.05
The "Trigger" bars are consistently higher than the "Baseline" bars across all categories. The error bars overlap in some cases, indicating that the difference may not be statistically significant.
### Key Observations
* The highest probability of a "Trigger" response is observed in the "MMS (SEP code)" category, approaching a probability of 1.0.
* The lowest probability of a "Trigger" response is observed in the "Risk/Safety" category, around 0.25.
* The "GPT-4o" line is consistently below both the "Trigger" and "Baseline" probabilities, suggesting that the model is less likely to trigger a response than either the baseline or the trigger conditions.
* The error bars indicate a significant degree of uncertainty in the probability estimates, particularly for the "Baseline" values.
### Interpretation
The data suggests that the "Trigger" conditions are more likely to elicit a response than the "Baseline" conditions across all tested categories. The large difference in probability for "MMS (SEP code)" suggests that this category is particularly sensitive to the trigger. The consistently low "GPT-4o" line indicates that the model is less reactive than the baseline or trigger conditions, potentially indicating a safety mechanism or a different response profile. The error bars highlight the need for further investigation to confirm the statistical significance of the observed differences. The categories themselves suggest a focus on security vulnerabilities and deployment-related risks, with "Risk/Safety" serving as a general control. The use of parenthetical phrases like "(SEP code)" and "(DEPLOYMENT!)", "(season)", "(greetings)" suggests specific contexts or triggers within those categories. The chart demonstrates a comparative analysis of response probabilities under different conditions, likely to assess the robustness and safety of a system or model.