## Diagram: Explainable Classification vs. REVEAL
### Overview
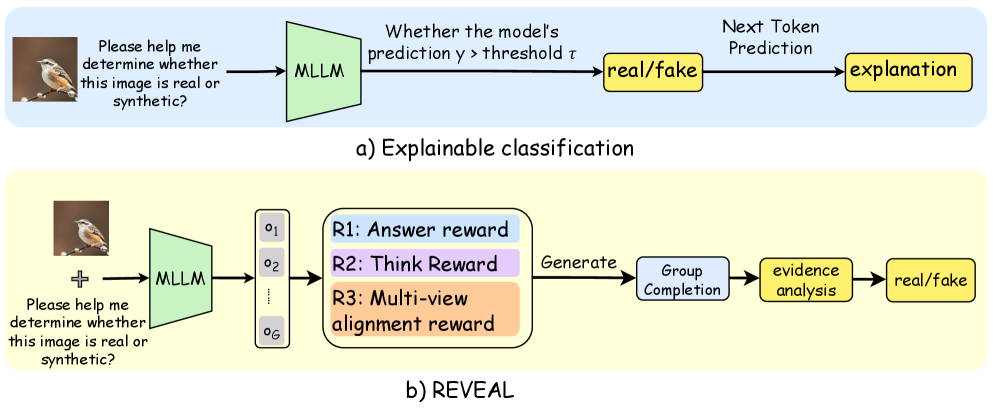
The image presents two diagrams illustrating different approaches to classifying whether an image is real or synthetic. The first diagram, labeled "Explainable classification," outlines a straightforward process involving a Multimodal Large Language Model (MLLM) and thresholding. The second diagram, labeled "REVEAL," depicts a more complex process with multiple reward signals and group completion.
### Components/Axes
**Top Diagram (Explainable classification):**
* **Input:** An image of a bird on a branch, accompanied by the question "Please help me determine whether this image is real or synthetic?".
* **MLLM:** A green trapezoid labeled "MLLM" (Multimodal Large Language Model).
* **Thresholding:** A text box stating "Whether the model's prediction y > threshold τ".
* **Classification:** A yellow rectangle labeled "real/fake".
* **Explanation:** A yellow rectangle labeled "explanation" after "Next Token Prediction".
* **Background:** Light blue background.
**Bottom Diagram (REVEAL):**
* **Input:** An image of a bird on a branch, accompanied by the question "Please help me determine whether this image is real or synthetic?".
* **MLLM:** A green trapezoid labeled "MLLM" (Multimodal Large Language Model).
* **Outputs:** A column of outputs labeled o1, o2, ..., oG.
* **Reward Signals:** Three reward signals:
* R1: Answer reward (light blue)
* R2: Think Reward (light purple)
* R3: Multi-view alignment reward (light orange)
* **Group Completion:** A light blue rectangle labeled "Group Completion".
* **Evidence Analysis:** A yellow rectangle labeled "evidence analysis".
* **Classification:** A yellow rectangle labeled "real/fake".
* **Background:** Light yellow background.
### Detailed Analysis or ### Content Details
**Explainable classification:**
1. The process begins with an image and a question.
2. The image and question are fed into an MLLM.
3. The model's prediction (y) is compared to a threshold (τ).
4. Based on this comparison, the image is classified as "real" or "fake".
5. The model provides an explanation for its classification.
**REVEAL:**
1. The process begins with an image and a question.
2. The image and question are fed into an MLLM.
3. The MLLM generates multiple outputs (o1 to oG).
4. These outputs are evaluated based on three reward signals: Answer reward, Think Reward, and Multi-view alignment reward.
5. The outputs are used for group completion.
6. Evidence analysis is performed.
7. Based on the evidence analysis, the image is classified as "real" or "fake".
### Key Observations
* The "Explainable classification" approach is simpler and more direct, focusing on a single prediction and threshold.
* The "REVEAL" approach is more complex, incorporating multiple outputs, reward signals, and group completion.
* Both approaches aim to classify images as "real" or "fake" and involve an MLLM.
### Interpretation
The diagrams illustrate two different strategies for determining the authenticity of an image using multimodal large language models. The "Explainable classification" method represents a more traditional approach, where the model's prediction is directly compared to a threshold to make a classification, followed by an explanation. In contrast, the "REVEAL" method employs a more sophisticated approach by generating multiple outputs and using various reward signals to guide the model towards a more robust and accurate classification. The "REVEAL" method's use of group completion and evidence analysis suggests a more thorough and potentially more reliable classification process. The choice between these methods would likely depend on the specific application and the desired balance between simplicity and accuracy.